Hawaii Top Things to Know Explore Now →

Kauai Guide
Big island guide, essential travel tips.
- Which Island to Visit? →
- Best Time to Visit →
- Hawaii Must See & Do →
- Hawaii Itineraries →
Travel Information
- Hawaii Weather →
- What to Pack? →
- Best Hawaii Island to Visit →
- Hawaii Safety Tips →
Hawaii Resources
- Hawaii Airports & Terminals →
- Hawaii Maps →
- Hawaii Travel News & Blog →
- Hawaii Visitor FAQ →
View our Hawaii Visitor Guides →
Hawaii Accommodations →
Lodging by island.
- Oahu Lodging
- Maui Lodging
- Big Island Lodging
- Kauai Lodging
Where to Stay
- Where to stay on Oahu →
- Where to stay on Maui →
- Where to stay on Big Island →
- Where to stay on Kauai →
When to Visit
- Best Time to Visit Oahu →
- Best Time to Visit Maui →
- Best Time to Visit the Big Island →
- Best Time to Visit Kauai →
Explore Hawaii Hotel Deals & Specials Search Now
- Hawaii Things to See & Do →
Tours by Island
- Big Island Tours
- Kauai Tours
Hawaii Attractions
- Oahu Attractions →
- Maui Attractions →
- Big Island Attractions →
- Kauai Attractions →
Hawaii Must See & Do
- Oahu Must See & Do →
- Maui Must See & Do →
- Big Island Must See & Do →
- Kauai Must See & Do →
Explore all Hawaii Tours Search Now
Hawaii Tourism Statistics
Handpicked Tours & Activities
Discount Hawaii Car Rentals
Hawaii Visitor & Traveler Data
Hawaii Visitors by Island 2022
If it's Hawaii tourism data you're looking for, then you're in the right place. We'll cover the latest tourism trends (within the last 1-3 years) on the Hawaiian islands and provide a series of graphics and summarized data to give you a good idea of what's happening by the numbers.
The adjacent graph shows the Total ARRIVAL Data in 2022 to each island (including multi-destination/island arrivals). You can also view our historical 2018 data graph , 2016 data graph , and 2006 data graph for comparison. A pie chart is not truly the best format to display the visitor totals for the various islands as the number of visitors shown in the chart is greater than the true total, as many visitors go to more than one island. However, for our purposes, it should give you an idea of how many visitors (percentage-wise) are arriving/visiting each island. Just keep in mind the actual arrival numbers are "inflated" a bit. A more accurate way to look at this is 'Visitor Days,' per island, but these percentages seen here provide an accurate overview of each island's visitation.
Latest DBEDT Tourism Updates
Department of business, economic development and tourism - monthly summary.
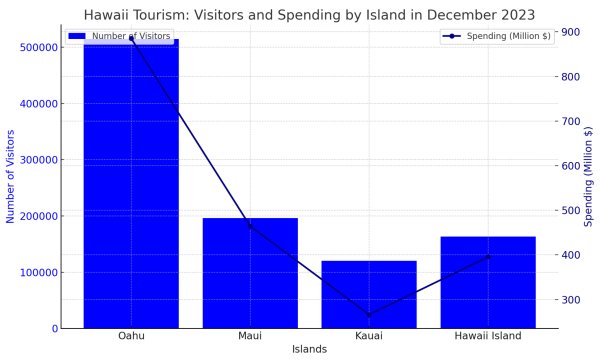
December 2023 Visitation & Spending
December 2023 Update
In December 2023, Hawaii marked the fifth consecutive month with declining visitor expenditures, experiencing a slight dip in both visitor arrivals (860,831 visitors, -1.3%) and spending ($1.96 billion, -1.2%) compared to December 2022. Despite this, the overall visitor spending for 2023 showed an increase from the previous year.
Visitor Arrivals and Spending : December 2023’s visitor count represented a 90.4% recovery from pre-pandemic levels in December 2019. The majority of visitors arrived by air service from the U.S. West and East, with a notable increase in arrivals by sea.
- U.S. West and East : Visitors from these regions showed a decrease in arrivals and spending compared to the previous year, but an increase from 2019.
- Japan and Canada : There was a significant increase in visitors from Japan compared to 2022, though numbers were still lower than in 2019. Canadian visitor numbers decreased from both 2022 and 2019.
Island-Specific Numbers :
• Oahu : Received 514,345 visitors with $885.1 million spent. • Maui : 196,402 visitors marked the highest number in five months post-wildfires, with $464.4 million spent. • Kauai : Saw 120,290 visitors, with spending reaching $266.0 million. • Hawaii Island : Welcomed 163,133 visitors and saw $309.5 million in spending.
The year 2023 concluded with an increase in total visitor spending to $20.78 billion, and total arrivals rose by 4.4% from 2022.
Official Press Release
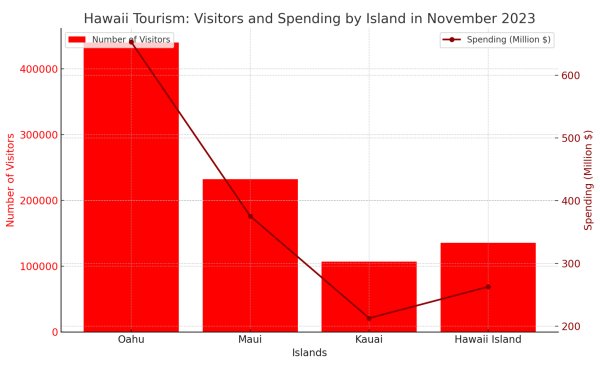
November 2023 Visitation & Spending
November 2023 Update
Visitor Arrivals and Spending : In November 2023, Hawaii experienced a slight increase in visitor arrivals but continued to see a decrease in spending compared to the previous year. A total of 731,233 visitors represented a modest 0.3 percent increase over November 2022, yet spending decreased to $1.53 billion, down 2.4 percent from the previous year.
Source of Visitors : The majority of visitors came by air service, mainly from the U.S. West and East. There was a small increase in visitors from Canada, and a significant surge from Japan compared to 2022, though numbers remained much lower than in 2019.
Key details from the Island in November 2023 :
• Oahu saw a rise in visitors to 440,049 but a drop in spending to $652.9 million. • Maui had 161,522 visitors, recovering from wildfire impacts, with spending at $375.5 million. • Kauai hosted 106,907 visitors, with spending increasing to $212.7 million. • Hawaii Island welcomed 135,645 visitors with spending reaching $262.7 million.
Overall, there was a year-to-date increase in total visitor spending and arrivals, with $18.82 billion in spending and 8,783,688 arrivals, indicating growth from 2022.
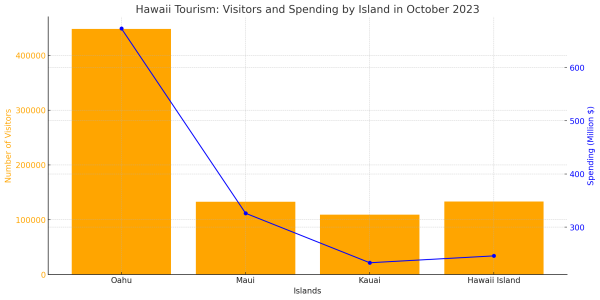
October 2023 Visitation & Spending
October 2023 Update
In October 2023, Hawaii continued to see a decline in both visitor arrivals and spending compared to 2022, marking the third consecutive month of downturn following the Lahaina wildfires.
Visitor Arrivals and Spending : October 2023 saw 734,582 visitors, a 3.2% decrease from October 2022, but a 92.3% recovery compared to pre-pandemic October 2019. Total visitor spending was $1.51 billion, down from $1.54 billion in October 2022 but up from $1.33 billion in October 2019.
Source of Visitors : The majority of visitors arrived by air service, primarily from the U.S. West and U.S. East. The U.S. West contributed 362,258 visitors, a decrease from 2022 but an increase from 2019. U.S. East saw a decline in arrivals compared to 2022 but an increase from 2019. Visitors from Japan increased significantly from 2022 but were much lower than in 2019. Canadian visitor numbers decreased from both 2022 and 2019.
Numbers by Island :
- Oahu : Received 448,096 visitors, a 14.7% increase from October 2022, with spending reaching $673.3 million, slightly up from the previous year.
- Maui : After the wildfires, visitation dropped to 132,909, a 42.3% decrease from 2022, and spending fell to $326.2 million, down 25.2% from the previous year.
- Kauai : Saw a stable visitor count at 109,337, virtually unchanged from 2022, but spending increased to $233.2 million, a significant rise of 34.1% from the previous year.
- Hawaii Island : Had 133,081 visitors, a 6% decrease from October 2022, with spending of $246.1 million, an 8% increase from the prior year.
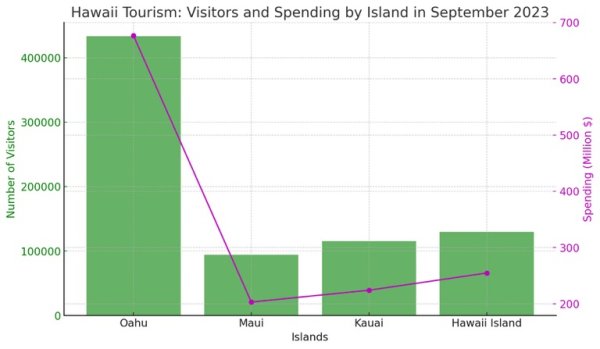
September 2023 Visitation & Spending
September 2023 Update
In September 2023, Hawaii experienced a decrease in both visitor arrivals and spending compared to the same period in 2022, partly due to the aftermath of the Lahaina fires on Maui. The total number of visitors was 651,286, marking a 7.4% decrease from September 2022, yet showing an 88.5% recovery from pre-pandemic levels of September 2019. Total visitor spending was $1.37 billion, a reduction from the $1.52 billion in September 2022 but an increase from September 2019's $1.25 billion.
The majority of visitors arrived by air, predominantly from the U.S. West and East. The U.S. West sent 329,187 visitors, a decrease from 2022 but an increase from 2019. U.S. East saw 153,635 visitors, down from 2022 but up from 2019. Visitors from Japan increased significantly compared to 2022 but were much lower than 2019 numbers. Canadian visitor numbers and spending also decreased compared to 2022 and 2019.
Visitor demographics varied across the islands. Oahu welcomed 433,209 visitors, Maui received 94,221 visitors, significantly impacted by the wildfires, Kauai hosted 115,305 visitors, and Hawaii Island saw 129,444 visitors. Each island exhibited unique trends in visitor arrivals and spending, reflecting diverse attractions and visitor experiences.
August 2023 Visitation & Spending
August 2023 Update
In August 2023, Hawaii's tourism was notably impacted by the Lahaina wildfires, leading to a 7.3% decrease in total visitor arrivals compared to August 2022. This figure represented an 83.0% recovery from the pre-pandemic levels of August 2019. The total number of visitors was 769,163, with a significant decline in arrivals to Maui due to the wildfires. Visitor spending for the month was $1.58 billion, lower than the $1.74 billion spent in August 2022, but still higher than the $1.50 billion from August 2019.
The majority of visitors, 766,023, arrived by air service, mainly from the U.S. West and U.S. East, with an additional 3,140 coming via a single cruise ship. The average length of stay for all visitors was 8.67 days, slightly less than in August 2022. The statewide average daily census was 215,020 visitors.
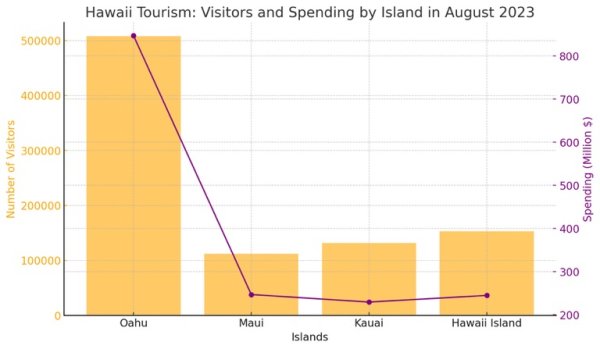
Visitor arrivals to different islands varied. Oahu saw an increase in visitors, with 507,702 arrivals. Hawaii Island and Kauai also experienced increases in visitor numbers. In contrast, Maui faced a significant drop in visitor arrivals, with only 112,259 visitors, less than half the volume of August 2022, primarily due to the Lahaina wildfires which led to the cancellation of 88 direct transpacific flights to Kahului.
Visitor demographics from different regions showed mixed trends. The U.S. West sent 392,427 visitors, a decrease from both 2022 and 2019. However, their spending, although lower than in 2022, was higher than in 2019. Visitors from the U.S. East also decreased compared to both 2022 and 2019, but their spending increased from 2019 levels. Visitors from Japan increased dramatically from 2022 but were much lower than 2019 figures. Canadian visitor numbers and spending decreased compared to 2022 and 2019.
There were 103,589 visitors from other international markets, including Oceania, Asia, Europe, Latin America, Guam, the Philippines, and the Pacific Islands. This figure was an increase from 2022 but a decrease from 2019.
July 2023 Visitation & Spending
July 2023 Update
In July 2023, Hawaii’s tourism showed a positive trend, with 932,713 visitors marking a 1.5% increase from July 2022 and representing a 93.7% recovery from July 2019. Visitor spending reached $2.05 billion, exceeding the figures from both 2022 and 2019. The majority of visitors, 929,386 in total, arrived by air, primarily from the U.S. West and East. The average length of stay for all visitors was 9.06 days.
From the U.S. West, there were 499,029 visitors, a decrease from 2022 but an increase from 2019, with spending of $972.1 million. Visitors from the U.S. East were comparable to 2022 numbers and higher than in 2019, with spending of $628.4 million. Visitor arrivals from Japan saw a significant increase compared to 2022 but were still lower than 2019 figures, with spending of $83.2 million. Canadian visitors slightly exceeded 2019 levels, with a total spend of $68.2 million.
The visitor count from other international markets, including Oceania, Asia, Europe, and Latin America, was 100,912, showing a modest increase from 2022 but a decrease from 2019. Total trans-Pacific flights servicing the islands were slightly fewer than in 2022 and 2019.
For the first seven months of 2023, total visitor spending amounted to $12.83 billion, showing an increase from both 2022 and 2019. Total arrivals during this period were 5,897,424, higher than in 2022 but lower than in 2019.
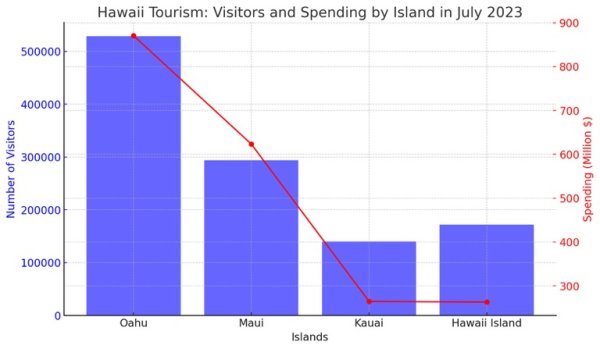
Island-specific details reveal that Oahu welcomed 528,585 visitors with a spending of $870.7 million. Maui received 293,681 visitors, with spending of $623.4 million. Kauai had 139,771 visitors and a spend of $264.5 million. Hawaii Island saw 171,957 visitors, with a spending of $263.0 million.
Visitor demographics varied, with a significant portion of U.S. West visitors being repeat visitors, and a majority staying in hotels. The first seven months of 2023 saw 3,110,046 visitors from the U.S. West, spending $6.05 billion. The U.S. East contributed 1,563,393 visitors, spending $4.05 billion. From Japan, there were 267,131 visitors, spending $427.5 million, and from Canada, 284,544 visitors, spending $726.2 million.
These statistics reflect a steady recovery in Hawaii’s tourism industry, with significant contributions from various international markets and a strong showing from U.S. visitors.
The tabular chart shown further below gives the breakdown of visitors in the islands on a month by month basis (color coded per island), based on data from 2019 & 2022 visitor reports.
Visitor Days & Visitor Expenditures
In considering the "health" of the tourism market, one must also put emphasis on the two factors that are the most important: "visitor days" and "visitor expenditures."
Mahalo for the tip by 'amberloo' at TripAdvisor. In her words, " If there are more visitor days and more money being spent annually over the long-term, the industry is healthy regardless of any other factors; such as mere arrival totals. The goal of many government planners is to increase "days" and "spending" while limiting (or even decreasing) arrival counts. "
Why limit arrival counts you might ask? One has to consider tourism "capacities" of the islands and how that will affect future trends. Maui and O'ahu likely reached their carrying capacity (for visitors) years ago, thus have few remaining competitive development opportunities and will not have the statistical fluctuations or upside growth potentials seen on Kaua'i. In fact, due to growth in recent years, Kaua'i has now about reached its own carrying capacity pending completion of on-going development.
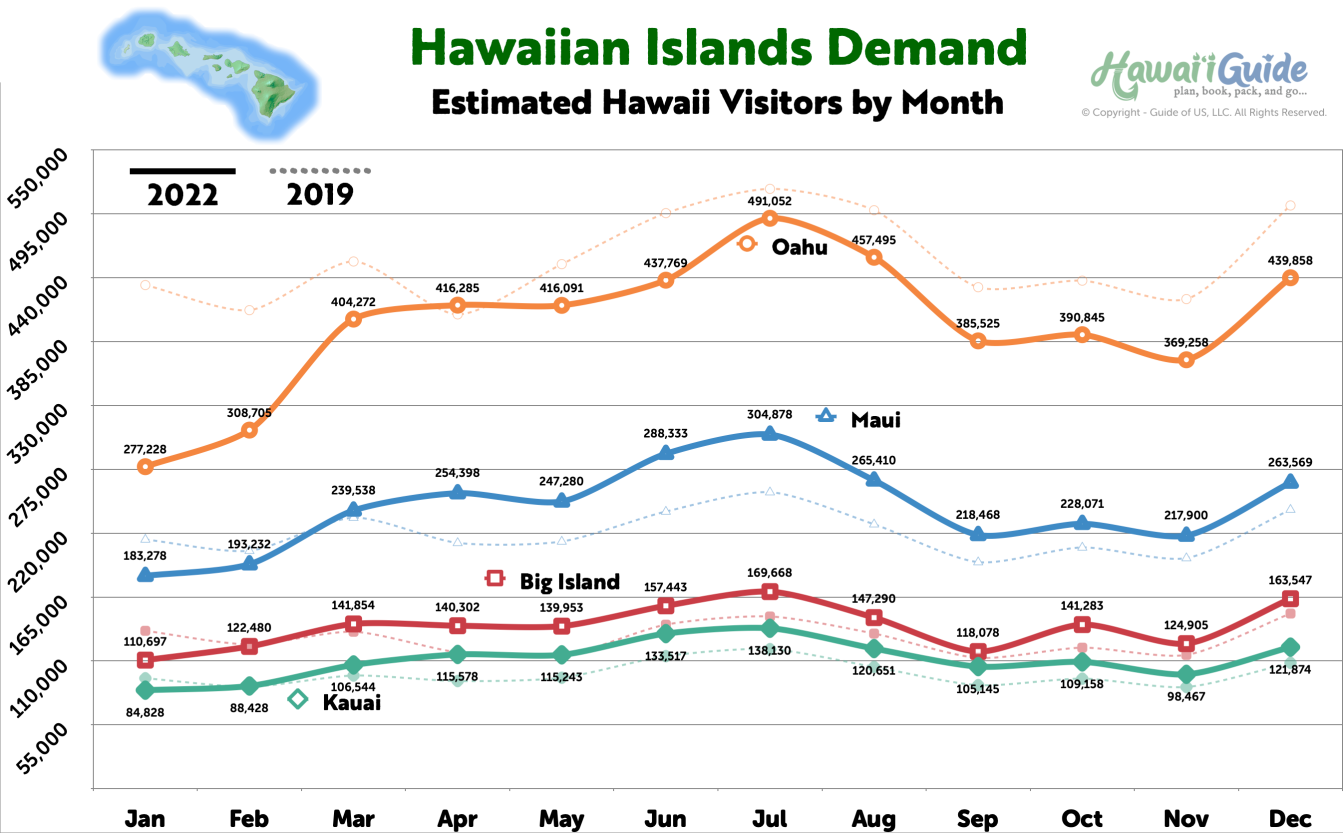
Estimated Hawaii Visitor Arrivals by Month 2019 & 2022
Individual Hawaiian Island Data
These statistics are "arrival" data - meaning visitors who arrived in the islands (either from the mainland US, abroad, or from another island).
When viewing these statistics, we encourage visitors to keep the geographic size of the islands in mind. For example, the Big Island and Kauai have very similar trends in arrivals. However, the Big Island is significantly larger geographically speaking than Kauai (in fact, it is larger than all of the other islands combined) so these visitor numbers alone cannot tell the complete story. Kauai and the Big Island may very well have the exact same number of visitors any given month, but the size of the island will also determine how "crowded" it feels.
Big Island of Hawaii Visitor Data
The largest in the chain typically ranges between 100,000-175,000 arrivals each month. Excluding the summer "hump" felt through all the islands, the number of arrivals fluctuates much less than some other islands in the chain, so visitation is usually about the same in Hawai'i. The events we noted on the best time to travel to Hawaii page, that are held each spring and fall, can increase visitor ratios on the island. The volcanic eruption that began in May 2018 is also to have likely affected arrival numbers for this period.
Maui Visitor Data
The second largest island in the chain typically ranges between 210,000-300,000 arrivals each month. The summer "hump" is by far the largest period of arrivals, but there are also significant spikes at other times during the year, most notably around the Christmas holidays.
Kauai Visitor Data
The fourth largest island in the chain typically ranges between 100,000-140,000 visitors each month. Kauai, in general, is a much quieter island (arrival wise) when compared to the likes of the other islands in the chain. But that may be due to its size and "theme" (all things green). The summer "hump" is the only really busy time on the island, though it's not as distinct as the "hump" Maui and Oahu experience. The 2018 winter and spring storms and subsequent closures on Kauai likely affected visitor arrivals after this period.
Oahu Visitor Data
The third largest island in the chain typically ranges between 450,000-570,000 visitors each month. As you can quickly see, that number quickly dwarfs the other islands arrival data. Oahu is widely popular with visitors abroad, and given that 75% of the state's population lives on this single island, the arrival data can skew accordingly.
Typical Hawaii Visitor Timeline
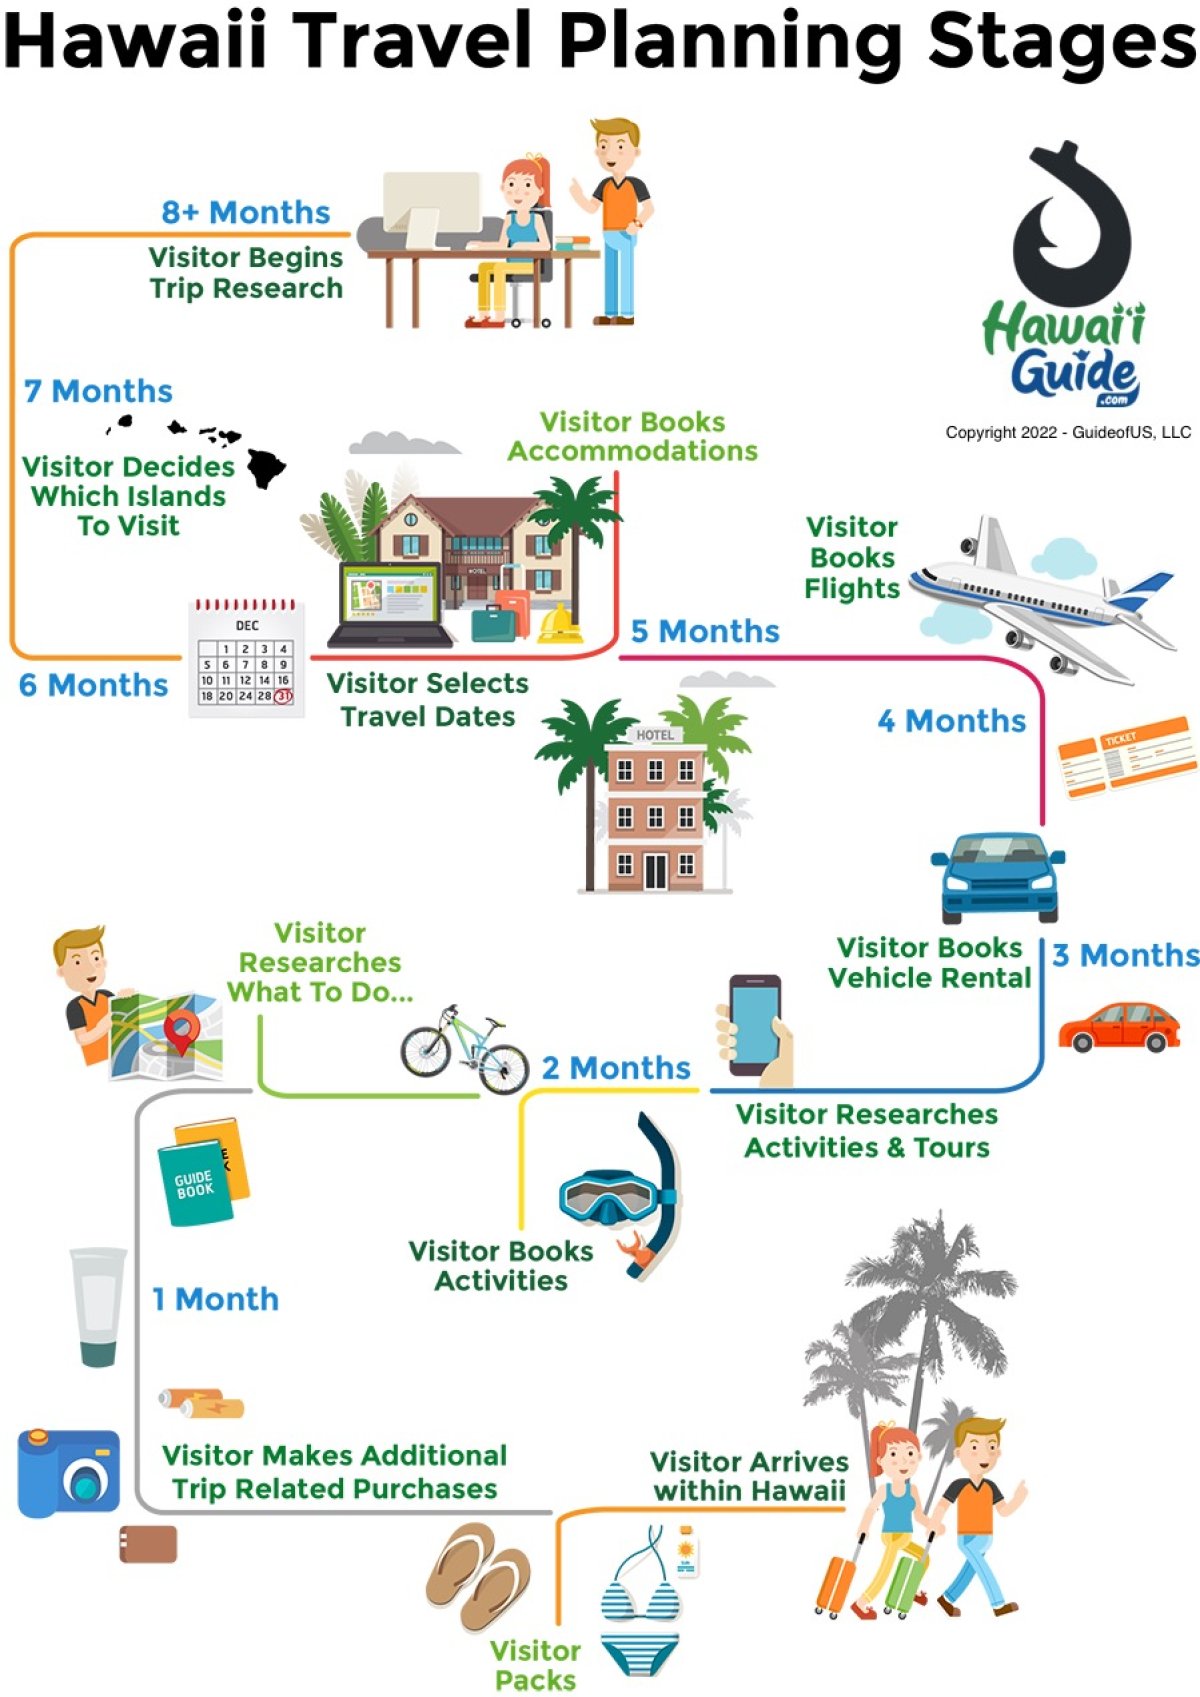
Typical Visitor Planning Timeline

More Information:
Hawaii Weathe r page or Selecting a Hawaiian island to visit
If you want even more detailed tourism specifications, please visit the Hawaii Department of Business, Economic Development & Tourism .
Molokai & Lanai Visitor Data
These two islands only make up slightly more than 1% of all visitor arrivals combined. If you're heading to either of these two islands and are curious about this data, we suggest you look at the detailed statistics provided on the Hawaii Tourism Authority website.
You may also be interested in...
Terms of use & disclosures.
This website's use is your expressly conditioned acceptance of the terms, conditions, and disclaimers found within our Disclaimer of Warranty and Limitation of Liability page without any modifications. Your use of this website constitutes your acceptance of all the terms , conditions, and disclaimers posted herein. If you do not agree with any part of these terms and conditions, you should not use this website. We also receive a small commission from travel partners for some of the links found on this website. All partners and related links comply with our Advertising Disclosures . For example, as an Amazon Associate, we earn from qualifying purchases. These links do not cost you anything and help provide the necessary funding to maintain this website. Mahalo!
Article Published/Updated: 03-18-2024
Download our Hawaii Map Packet
Includes most major attractions, all major routes, airports, and a chart with estimated driving times for each respective island..
Our popular Summary Guidesheets are now included.

Download your copy of our... 2024 Hawaii Travel Guide
Hawaii-Guide.com has been featured in...

Hawaii Visitor Information...

Try out our new AI Powered Search & Chatbot →

Plus & Premium Benefits
Donate and remove ALL the ads
Mahalo for your support!
By donating to our small business, you accept and acknowledge the donation terms . Mahalo!
- Topics ›
- Domestic tourism in the U.S. ›
U.S. Tourists Outnumber Hawaiians 5 To 1
Tourism can be a valuable source of income for countries, regions and cities, but a high influx of visitors can cause problems with energy supply, infrastructure and general cost of living for the native inhabitants of said areas. Hawaii, for example, is one of the most popular tourist destinations for travelers from the United States and Japan and many of its inhabitants have long been critical of the islands' booming tourism industry. According to data from the Hawaii Tourism Authority and the U.S. Census Bureau, the annual number of tourists from the U.S. alone is five times higher than the population of the tiny island group.
As our chart illustrates, the number of U.S. travelers visiting islands like Hawai'i, O'ahu or Maui has been rising continuously since 2014, crossing the 7-million mark for the first time in 2022. Even in the first year of the coronavirus pandemic, roughly two million U.S. Americans flocked to the island state, which was annexed by the United States in 1898 against staunch resistance by the native population.
Hawaii has also been a popular holiday destination for the Japanese for decades, even though tourist influx from the country is only slowly picking up steam again since 2020. The relationship between Hawaii and Japan is a fraught one though: On December 7, 1941, Japan's air force attacked Pearl Harbor on O'ahu , effectively prompting U.S. involvement in World War II.
In 2019, the overall number of visitors to Hawaii stood above the 10-million threshold, a development cut short by Covid-19. Between January and June 2023, around five million people visited the islands for an average duration of nine nights, spending $10.7 billion in the process. Roughly $8.5 billion of the total amount was spent by the 3.9 million visitors from the United States.
Description
This chart shows the countries with the most visitors to Hawaii per year and the population of Hawaii.
Can I integrate infographics into my blog or website?
Yes, Statista allows the easy integration of many infographics on other websites. Simply copy the HTML code that is shown for the relevant statistic in order to integrate it. Our standard is 660 pixels, but you can customize how the statistic is displayed to suit your site by setting the width and the display size. Please note that the code must be integrated into the HTML code (not only the text) for WordPress pages and other CMS sites.

Infographic Newsletter
Statista offers daily infographics about trending topics, covering: Economy & Finance , Politics & Society , Tech & Media , Health & Environment , Consumer , Sports and many more.
Related Infographics
Sponsored post by booking.com, the how of improving social cohesion with local tourism, the us remains the largest domestic travel market, atmospheric river, the scale of california's pineapple express phenomenon, tourism & hospitality, the top destinations of indian tourists, cities with the highest domestic tourism spending: 2032 forecast, travel and tourism, how often do americans travel, business travel isn’t going anywhere, despite growing digital connectivity, domestic spending in tourism eclipses international for the major cities, domestic gives way to international travel: 2032 forecast, short-term rental, which u.s. cities have high airbnb densities, billionaires, the billionaires' brand emporium, critical race theory, anti-crt measures adopted by 28 u.s. states.
- Who may use the "Chart of the Day"? The Statista "Chart of the Day", made available under the Creative Commons License CC BY-ND 3.0, may be used and displayed without charge by all commercial and non-commercial websites. Use is, however, only permitted with proper attribution to Statista. When publishing one of these graphics, please include a backlink to the respective infographic URL. More Information
- Which topics are covered by the "Chart of the Day"? The Statista "Chart of the Day" currently focuses on two sectors: "Media and Technology", updated daily and featuring the latest statistics from the media, internet, telecommunications and consumer electronics industries; and "Economy and Society", which current data from the United States and around the world relating to economic and political issues as well as sports and entertainment.
- Does Statista also create infographics in a customized design? For individual content and infographics in your Corporate Design, please visit our agency website www.statista.design
Any more questions?
Get in touch with us quickly and easily. we are happy to help.
Feel free to contact us anytime using our contact form or visit our FAQ page .
Statista Content & Design
Need infographics, animated videos, presentations, data research or social media charts?
More Information
The Statista Infographic Newsletter
Receive a new up-to-date issue every day for free.
- Our infographics team prepares current information in a clear and understandable format
- Relevant facts covering media, economy, e-commerce, and FMCG topics
- Use our newsletter overview to manage the topics that you have subscribed to
Eclipse expected to cause travel chaos; here’s how to navigate the roads and skies
(CNN) - Millions of Americans are expected to travel to see the total solar eclipse on April 8. Cities and towns along the route of totality are expecting big crowds.
While the boost in visitors is good for local economies, the extra people are expected to cause chaos on the roads and in the skies.
“You really need to plan ahead to be safe,” said Elizabeth Carey, director of public relations for AAA Western and Central New York.
Communities from Mexico to Canada are in the path of totality, meaning the moon will completely cover the sun, creating total darkness during daylight. Some areas like western New York are expecting a million visitors.
AAA has several tips for drivers like navigating the old-fashioned way with a map, especially if you’re traveling in less populated areas.
“In a very rural area, you’re talking about wilderness with no cell service,” Carey said.
AAA also recommends drivers not try and watch the eclipse while driving, have their headlights on, don’t wear eclipse glasses while driving, and watch out for animals.
“It could trigger wildlife to be out and about,” said Carey.
If you’re flying, the Federal Aviation Administration is warning travelers to expect long lines and possible delays at airports. Monday’s eclipse falls during the busy spring break travel season.
The FAA says they’re expecting more than 46,000 flights the day after the eclipse.
Copyright 2024 CNN Newsource. All rights reserved.

HPD launches attempted murder investigation after shooting in Moiliili leaves man critically injured; suspect in custody

Drive-thru shooting in busy Ewa Beach area leaves neighbors on edge

Kauai police chief could face disciplinary action after losing his firearm a second time

Here’s how to watch the Merrie Monarch Festival on air and online

Best trip ever: A Hawaii woman is $1M richer after hitting the jackpot in Vegas
Latest news.

Potential heirs of DHHL beneficiaries still learning they could get share of landmark settlement
Hpd investigating after shooting in moiliili leaves man critically injured; suspect in custody.

One Tech Tip: How to use apps to track and photograph the total solar eclipse

First Alert Forecast: Gusty winds expected to hold firm through Friday

18-year-old charged with violating mask law: ‘I didn’t even know it was a law. Nobody knew it was a law’

An official website of the United States government
Here’s how you know

Official websites use .gov A .gov website belongs to an official government organization in the United States.
Secure .gov websites use HTTPS A lock ( Lock A locked padlock ) or https:// means you’ve safely connected to the .gov website. Share sensitive information only on official, secure websites.

- Documents Library
2024 European Union Tariff Rate Quota Data
The European Union (EU) Steel and Aluminum Tariff Rate Quota (TRQ) Periodic Limit Tables for January though December 2024 are reviewed prior to the start of each quota period. Full instructions and entry filing guidance are in the EU TRQ Steel and Aluminum Quota Bulletins located on the Quota Bulletins page.
CBP Publication Number

IMAGES
COMMENTS
Visitor Satisfaction & Activity Report. Air Visitor Spending Pattern. Visitor Plant Inventory. Timeshare Report. Vacation Rental Performance. Resident Sentiment Survey. Air Seats Capacity Outlook. Historical Visitor Statistics. Hawaii Tourism Authority Research & Report Site.
USA Fact Sheet with February 2024 data 2024 US Total 2024 US West 2024 US East Japan. Japan Fact Sheet with February 2024 data ... Hawaii Tourism Authority on Facebook Hawaii Tourism Authority on Twitter Hawaii Tourism Authority on Instagram Hawaii Tourism Authority on YouTube
2022 and a comparison with 202visitor data. 1 Included in this report are characteristics data from ... Commerce National Travel and Tourism Office (NTTO), updated statistics on flights and air seats from the Cirium Diio Mi (DIIO) airline database , and final Air Traffic Summary reports received from ... [email protected] . DBEDT ii ...
1st Quarter 2024 Report Download Tourism Data Tables (spreadsheet) International visitor arrivals continued to increase, while domestic visitor arrivals further decreased in the fourth quarter of 2023. The total number of visitor arrivals by air decreased 38,481 or 1.7 percent in the fourth quarter of 2023, compared to the same quarter of 2022 (Table D-2).
2021 and a comparison with 2020 visitor data. Included in this report are characteristics data from ... 19 travel restrictions and the "conditional Sail" order enforced by the U.S. Centers for Disease Control ... [email protected] . DBEDT ii 2021 Annual Visitor Research Report. TABLE OF CONTENTS . SUMMARY OF 2021 VISITORS TO HAWAI'I ...
2020 and a comparison with 2019 visitor data. Included in this report are characteristics data from visitors who came to Hawai'i' by air or by cruise ship. Visitor statistics are categorized by Hawai'i's Major Market Areas (MMA), by select countries, purpose of trip, accommodation type and by island.
February 2024 Hawaii Vacation Rental Performance. DBEDT's Tourism Research Branch continuously provides insightful information benefitting businesses and individuals who rely on having timely, accurate and comprehensive data about Hawai'i tourism for their own usage. Research data provided by DBEDT and HTA are utilized by tourism industry ...
The Tourism Data Warehouse lets you customize and download datasets about Hawaii's tourism industry, with many of them updated monthly. Visitor Trends: this section provides data on the number of visitors, days, expenditure, length of stay, daily census, and per person per day spending by market and by island for monthly, quarterly, and annually.
ABOUT THIS REPORT . The 2019 Annual Visitor Research report provides the final statistics on Hawai'i's visitor industry in 2019 and a comprehensive comparison with 2018 visitor data.
Department of Business, Economic Development & Tourism. Search this site Search. Home; Data. Hawaii Data Book; Economic Data Warehouse
2016 Monthly Visitor Statistics. 2015 Monthly Visitor Statistics. 2014 Monthly Visitor Statistics. 2013 Monthly Visitor Statistics. 2012 Monthly Visitor Statistics. 2011 Monthly Visitor Statistics. 2010 Monthly Visitor Statistics. 2009 Monthly Visitor Statistics. 2008 Monthly Visitor Statistics.
2020-01-29 Hawaii Visitor Statistics Released for December 2019. HONOLULU - Visitors to the Hawaiian Islands spent $17.75 billion in 2019, an increase of 1.4 percent compared to 2018, according to preliminary year-end statistics released today by the Hawaii Tourism Authority. Visitor spending includes lodging, interisland airfare, shopping ...
If it's Hawaii tourism data you're looking for, then you're in the right place. We'll cover the latest tourism trends (within the last 1-3 years) on the Hawaiian islands and provide a series of graphics and summarized data to give you a good idea of what's happening by the numbers.The…The tabular chart shown further below gives the breakdown of visitors in the islands on a month by month ...
Step 1: estimate contribution of tourism to each sector's GDP using the 2017 Hawaii Input‐Output model. Step 2: estimate GDP of tourism sector as the sum of each sector's GDP generated by tourism. Step 3: re‐estimate GDP of other sectors without tourism portion. Tourism 18.1%.
This brief presents contributions of tourism to Hawaii economy, estimated using the economic relationships reflected in the 2017 State of Hawaii Input-Output (IO) model. ... GDP and jobs are based on the latest GDP and job data from the U.S. Bureau of Economic Analysis (BEA) at the time of release and subject to change when the Hawaii GDP and ...
By 2025, visitor arrivals to Hawaii are projected to exceed 10 million persons with visitor spending expected to reach $22.9 million. 1. One of the most popular data series on the Department of Business, Economic Development and Tourism's (DBEDT) website is the daily passenger counts. 2The daily passenger counts include passengers arriving in ...
Fact Sheet: Benefits of Hawai'i's Tourism Economy . Hawai'i Tourism Industry in February 2024 1 In February 2024, a total of 772,480 visitors arrived in the Hawaiian Islands and total visitor spending measured in nominal dollars was $1.66 billion. There were 753,750 total visitors in February 2023 and total visitor spending was $1.64 billion.
The tourism statistics for March 2023 were consistent with the other public Hawai'i data released earlier this month: job counts in the hospitality sector increased by 11 percent, the hotel occupancy rate increased by 1.7 percentage points, and the transient accommodations tax increased 17.1 percent this March as compared with the same month ...
The Hawaii State Data Book is the most comprehensive statistical book about Hawaii in a single compilation. ... Economic Development & Tourism (808) 586-2470 dbedt.hawaii.gov/economic. Laci Goshi Department of Business, Economic Development & Tourism (808) 587-9006 dbedt.hawaii.gov. About Us. Contact; UIPA Requests; DBEDT Limited English ...
The report also contains island-by-island data, and compared to 2019, arrivals to Oahu remained flat at 453,700 visitors. Kauai and Hawaii Island experienced modest increases of 4% and 5% ...
According to data from the Hawaii Tourism Authority and the U.S. Census Bureau, the annual number of tourists from the U.S. alone is five times higher than the population of the tiny island group ...
In sum, results from the 2022 VSAT survey and visitor arrival and expenditure data support the importance of the film industry in promoting Hawai'i as a tourist destination. Approximately 12.7% of all visitors were motivated at least in part to visit Hawai'i due to television programs
Expenditures Made By Hawaii Noncandidate Committees From January 1, 2008 Through December 31, 2023. 83 recent views.
Travel Data The Hawai'i Safe Travels Program ended on March 26, 2022. For visitor statistics, go to http://dbedt.hawaii.gov/visitor/tourism/. While In Hawai'i ...
(CNN) - Millions of Americans are expected to travel to see the total solar eclipse on April 8. Cities and towns along the route of totality are expecting big crowds. While the boost in visitors ...
Mengshin Lin/AP. "People tend to assume Hawaii is part of the US and therefore it's covered by NATO," he says. But, he concedes, the tip-off is in the alliance's name - North Atlantic ...
4/ Hawaii County has recently resumed posting building permits via Electronic Processing Information Center (EPIC) and this MEI reflects July through September 2021. Source: Hawaii Department of Business, Economic Development and Tourism; Hawaii Department of Taxation; county building departments;
2004 Visitor Satisfaction & Activity Report. 2003 Visitor Satisfaction & Activity Report. 2002 Visitor Satisfaction & Activity Report. 2001 Visitor Satisfaction & Activity Report (spreadsheet) Quarterly Reports 2023 Visitor Satisfaction Study - Forth Quarter (October-December) 2023 Visitor Satisfaction Infographic - Forth Quarter (October ...
The Tourism Data Warehouse lets you customize and download datasets about Hawaii's tourism industry, with many of them updated monthly. Visitor Trends: this section provides data on the number of visitors, days, expenditure, length of stay, daily census, and per person per day spending by market and by island for monthly, quarterly, and annually.
The European Union (EU) Steel and Aluminum Tariff Rate Quota (TRQ) Periodic Limit Tables for January though December 2024 are reviewed prior to the start of each quota period. Full instructions and entry filing guidance are in the EU TRQ Steel and Aluminum Quota Bulletins located on the Quota Bulletins page. Attachment.