The Straits Times
- International
- Print Edition
- news with benefits
- SPH Rewards
- STClassifieds
- Berita Harian
- Hardwarezone
- Shin Min Daily News
- SRX Property
- Tamil Murasu
- The Business Times
- The New Paper
- Lianhe Zaobao
- Advertise with us

‘Go home’: Too much tourism sparks backlash in Spain

MADRID - Anti-tourism movements are multiplying in Spain, the world’s second most visited country, prompting the authorities to try and reconcile the interests of locals and the lucrative sector.
Rallying under the slogan “The Canaries have a limit”, a collective of groups on the archipelago off north-west Africa are planning a slew of protests on April 20.
The Canaries are known for volcanic landscapes and year-round sunshine, and attract millions of visitors from all over the world.
Groups there want the authorities to halt work on two new hotels on Tenerife, the largest and most developed of the archipelago’s seven islands.
They are also demanding that locals be given a greater say in the face of what they consider uncontrolled development which is harming the environment.
Several members of the collective Canaries Sold Out also began an “indefinite” hunger strike last week to put pressure on the authorities.
“Our islands are a treasure that must be defended,” the collective said.
The Canaries received 16 million visitors in 2023, more than seven times its population of around 2.2 million people.
This is an unsustainable level given the archipelago’s limited resources, Mr Victor Martin, a spokesman for the collective, told a recent press briefing, calling it a “suicidal growth model”.
‘Social revulsion’
Similar anti-tourism movements have sprung up elsewhere in Spain and are active on social media.
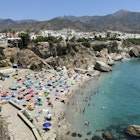
In the southern port of Malaga on the Costa del Sol, a centre of Spain’s decades-old “soy y playa” or “sun and beach” tourism model, stickers with unfriendly slogans such as “This used to be my home” and “Go home” have appeared on the walls and doors of tourist accommodations.
In Barcelona and the Balearic Islands, activists have put up fake signs at the entrances to some popular beaches warning in English of the risk of “falling rocks” or “dangerous jellyfish”.
Locals complain a rise in accommodation listings on short-term rental platforms such as Airbnb have worsened a housing shortage and caused rents to soar, especially in town centres.

The influx of tourists also adds to noise and environmental pollution and taxes resources such as water, they add.
In the north-eastern region of Catalonia, which declared a drought emergency in February, anger is growing over the pressure exerted on depleted water reserves by hotels on the Costa Brava.
“Our concern is to continue to grow tourism in Spain so that it is sustainable and does not generate social revulsion,” vice-president Jose Luis Zoreda of tourism association Exceltur told a news conference on April 16 when asked about the protest movements.
The group said it expects Spain’s tourism sector will post record revenues of €202.65 billion (S$290 billion) in 2024.
Loudspeaker ban
Before the Covid-19 pandemic brought the global travel industry to its knees in 2020, protest movements against overtourism had already emerged in Spain, especially in Barcelona.
Now that pandemic travel restrictions have been lifted, tourism is back with a vengeance – Spain welcomed a record 85.1 million foreign visitors in 2023.
In response, several cities have taken measures to try to limit overcrowding.

The northern seaside city of San Sebastian in March 2023 limited the size of tourist groups in the centre to 25 people and banned the use of loudspeakers during guided tours.
The southern city of Seville is mulling over charging non-residents a fee to enter its landmark Plaza de Espana, while Barcelona had removed a bus route popular with tourists from Google Maps to try to make more room for locals.
Housing Minister Isabel Rodriguez said over the weekend that “action needs to be taken to limit the number of tourist flats” but stressed the government is “aware of the importance of the tourist sector”, which accounts for 12.8 per cent of Spain’s economic activity. AFP

Join ST's Telegram channel and get the latest breaking news delivered to you.
- Environmental issues
Read 3 articles and stand to win rewards
Spin the wheel now
Next stop for Spanish tourism excellence: Sustainability
Tourism is vital to Spain. The country’s natural attractions and cultural assets draw crowds from around the world—making many of its communities reliant on tourism. Pre-pandemic, Spain was the second-largest tourism destination in the world, drawing 84 million visitors in 2019 who brought over €92 billion in revenue. 1 “Spain: Economic and infrastructural situation,” Climate ADAPT, Climate ADAPT website, updated March 15, 2021; “Satellite account of tourism in Spain,” INE, January 7, 2022. Travel and tourism accounted for around 14 percent of Spain’s total GDP and provided one in eight jobs. In some communities, tourism contributed to over 20 percent of all economic activity . While these figures plummeted during COVID-19, travel and tourism is recovering and Spain remains dependent on success in tourism.
Spain’s tourism sector now faces new challenges. Fears of a global recession, and geo-political uncertainty, could put pressure on tourism. And as travel resumes in an era of high inflation, Spain will likely face stiff competition from several destinations that also offer sunshine and coastal vacations at similar, or lower, prices—Egypt, Greece, and Turkey, for example.
The sector also faces physical and economic threats due to climate change. The Mediterranean basin is getting warmer: the number of days above 37°C in southern Spain is expected to double by 2050 and rising temperatures increase the risk of drought, water stress, wildfires, and floods. 2 “ A Mediterranean basin without a Mediterranean climate? ” McKinsey Global Institute, May 2020. Extreme weather is already evident as the pre-summer season of 2022 saw temperatures climb above 40°C in Seville. 3 “Spain is hit by the hottest pre-summer heatwave for 20 years as temperatures climb to 43 C,” Euronews, June 14, 2022. An increase in the number of “too hot” days could discourage tourism, particularly in peak season. For instance, a 2022 survey by a travel insurance company found that 65 percent of UK holiday makers thought Spain would be too hot to visit by 2027. 4 Charlotte Elton, “Spain, Greece, Turkey: Most Brits think holiday hotspots will be ‘too hot’ to visit by 2027,” Euronews, September 9, 2022.
Of course, Spain’s tourism sector cannot combat climate change alone. But this backdrop underscores the urgency to act. Globally, tourism is a significant contributor to emissions, and Spain can play a role in emissions reduction. In 2019, tourism was responsible for about 11 percent of greenhouse gas emissions, worldwide. Of this, the largest emissions came from domestic and international tourism in China, India, and the United States. Compared to these top three, Spain ranks at number 16 for emissions from tourism. 5 Sustainability in travel 2021: Quantifying tourism emissions for destinations, Skift Research, June 2021. Considering the size of Spain’s tourism industry, the country compares well against these destinations, but there is room for improvement.
Spain can set itself apart by prioritizing sustainability, including environmental issues such as water usage, plastic waste, carbon emissions, and social issues such as how tourism affects local communities. Globally, travelers are becoming more aware and are seeking out vacations with less impact on the environment and on local communities. Sustainability could become a key differentiator.
Furthermore, sustainable travel could draw discerning premium travelers who will likely be willing to pay for offerings that uphold their values. But efforts to draw these travelers will need to extend beyond marketing and involve real operational changes. Gen Z travelers, in particular, don’t care what tourism businesses say about their sustainability efforts, they want to see it in practice. 6 Dawit Habtemariam, “Tourism’s sustainability pitch needs to be more subtle for Gen Z,” Skift, March 8, 2023. Gen Zs, who typically have a heightened awareness of climate change, are looking for eco-friendly accommodation options. Skift found that 38 percent of Gen Zs across the world would consider staying in green accommodation on their next holiday, compared to the 33 percent response rate of those over 25. 7 Mary Ann Ha, “Meeting the high expectations of the Gen Z traveler: New report,” Skift, June 21, 2022.
This article examines the key aspects of sustainability that are relevant to travel and tourism and suggests ways in which stakeholders across Spain’s tourism sector could prioritize and invest in sustainable offerings. Such actions can ensure that this important sector remains competitive, and help to safeguard its assets for future generations.
Spain is a leading destination, but faces strong competition and a tough operating environment
The physical and economic consequences of climate change, global economic environment, strong competition, and changing consumer preferences all put pressure on the sector. Worldwide, rising inflation could prompt consumers to cut back on travel, or “downtrade” to cheaper destinations. While “revenge travel” boosted tourism as travel restrictions eased, the threat of a looming recession could dampen appetite for travel.
European travelers want to visit beaches that are conveniently close, warm, and affordable. The largest outbound markets for sun and beach tourism include Germany, the United Kingdom, Scandinavia, the Netherlands, Belgium, and Austria. Spain is a popular destination for sun and sand, accounting for almost one-third of international overnight trips to the EU’s coastal areas in 2021. 8 Eurostat dataset: Nights spent at tourist accommodation establishments by degree of urbanization and coastal/non-coastal area, accessed January 18, 2022. But, Spain competes with other destinations, in the Mediterranean and beyond, that cater to these tourists.
Even if overall demand falls, select locations across the country are at risk of over-tourism. Pre-COVID-19, a World Economic Forum report placed Spain first out of 140 competitive countries in travel and tourism. 9 The Travel & Tourism competitiveness report 2019, World Economic Forum, September 4, 2019. The report warned that one-third of international arrivals are concentrated in the top ten countries, and this concentration can lead to severe pressure, and negative effects, on tourism infrastructure and services as well as local populations.
Several Spanish beach destinations have struggled with unruly visitors, and some cities have experienced an anti-tourism backlash in the wake of overcrowding. 10 “Irish tourist seriously injured in fall from balcony in Spain,” Murcia Today, May 5, 2022; “Why Barcelona locals really hate tourists,” Independent , August 12, 2017. Authorities have stepped in to manage the situation in specific locations. For example, in 2020, Spain introduced new laws to limit alcohol consumption at all-inclusive resorts in the Balearic Islands. 11 “Britons limited to six drinks a day in Ibiza and Majorca on all-inclusive breaks,” Evening Standard, April 29, 2022. And several cities, including Madrid and Barcelona, introduced stricter regulations for private short-term accommodation rental to tourists to protect the long-term housing market. 12 “Barcelona wants to ban renting private rooms to tourists,” Bloomberg, February 5, 2021; “Barcelona takes on Airbnb,” New York Times, September 22, 2021.
These efforts could make tourism more sustainable for the long term. But the industry itself may be adding to conditions that make tourism unsustainable for the local workforce. Seasonality is a major hurdle in this regard. The country’s core tourism destinations have high seasonality, leading to peaks and troughs in employment. Unemployment reaches around 20 percent in the low season (exhibit).
A focus on all aspects of sustainability can improve the sector’s (and the country’s) perception and reputation—and ultimately affect tourists’ willingness to visit.
Would you like to learn more about our Travel, Logistics & Infrastructure Practice ?
What sustainability means for travel and tourism.
Sustainability is becoming increasingly important to travelers. In 2022, Booking.com found that more than 70 percent of global travelers intend to travel more sustainably over the next year (a 10 percent increase on the company’s 2021 survey) and 35 percent said that the sustainability efforts of accommodation and transport providers play a strong role in their booking decisions. 13 Sustainable travel report 2022 , Booking.com.
But what does sustainable travel mean? According to the World Tourism Organization, sustainable tourism addresses the needs of visitors, the industry, the environment, and host communities based on three interdependent factors: 1) social sustainability (respect for the socio-cultural authenticity of host communities, support for local businesses, and levels of tourism that are acceptable to local communities); 2) environmental sustainability (measures to reduce environmental impact and preserve natural heritage and biodiversity); and 3) economic sustainability (business models that achieve economic growth without negatively impacting social, environmental, or cultural aspects of communities). 14 “Sustainable development,” UNWTO website.
By improving environmental and social sustainability, organizations across the travel and tourism value chain can strengthen their business models and reach economic sustainability. Without considering social and environmental factors, economic viability may be difficult to reach or maintain in the long term.
Several countries are taking an integrated approach to tourism development with the goal of becoming more resilient, sustainable, and inclusive. In some instances, this means adapting a country’s tourism offerings to reduce seasonality and the strain it puts on local infrastructure and resources. Increasing visitors in off-peak periods can lead to year-round jobs and businesses. For example, Slovenia has committed to 20 projects to transform mountain destinations into year-round resorts for active holidays outside of ski season. 15 OECD tourism trends and policies 2022, OECD. And Norway’s “Norway all year round” plan aims to spread tourist traffic across several locations and seasons. The plan intentionally does not market Norway as a cruise destination and aims to attract travelers in source markets who are available to travel all year round, and have the means to do so. 16 “Making Norway an all-year-round destination,” Sustainable Tourism in the North website.
Transforming the tourism workforce
New Zealand’s Tourism Industry Transformation Plan begins with a focus on the workforce as the core element of developing a thriving tourism system. The plan paves the way for better experiences for those within the industry as a way to deliver better outcomes for employees, businesses, and visitors.
The plan puts forward new ways of working, for instance, to improve employment standards and practices relating to decent pay and career progression, and to provide fit-for-purpose education and training.
Another innovation “embrace the flux, enable the flex” aims to reframe the tourism industry’s attitude to seasonality. Rather than the peaks and troughs being a barrier to attracting and retaining employees, the industry can use peaks and troughs to its advantage to upskill people, provide consistent employment, and reduce barriers to people holding multiple jobs across the year and across sectors.
One of the initiatives involves collaboration between tourism and conservation employers to help employees maintain stable employment, remain in regions with limited employment offerings, and support the wider community. It also enables tourism employees to gain local conservation knowledge and skills, and those workers can then share their expertise and insights with visitors and increase the value of the tourism offering in the region.
Source: Tourism Industry Transformation Plan: He Mahere Tiaki Kaimahi, Better Work Action Plan, New Zealand Government, March 2023.
Other country-level social and economic sustainability initiatives focus on the tourism workforce. New Zealand recently launched a transformation plan aimed at improving conditions for those who work in the tourism industry, as a basis for transforming the entire sector (see sidebar “Transforming the tourism workforce”).
Travel businesses have also taken steps to reduce the effects of seasonality on the local workforce, for example, by sharing staff. In Geneva, the Ice Castles attraction that has a four-month winter season shares staff with the Lake Geneva Ziplines & Adventures company. This provides extra work and helps to retain staff at both businesses each season. 17 Nathan Andrew, “How to maximize the value of tourism shoulder season,” Blend, August 2021.
The social, environmental, and economic aspects of sustainability are intertwined in global consumers’ perspectives. Booking.com respondents around the world said they chose sustainable options because they wanted to reduce their impact on the environment, have a more locally relevant experience, or believed that sustainable properties treat communities better. 18 Sustainable travel report 2022 , Booking.com.
Spanish respondents held similar views on sustainability as their global counterparts—they are concerned about waste and energy consumption, and 79 percent intend to walk, cycle, or take public transport during future trips. Respect for local communities is important, too, as 68 percent want authentic experiences that are representative of local culture. In addition, 68 percent will go out of their way to avoid popular destinations and attractions to avoid contributing to overcrowding. 19 Sustainable travel report Spain 2022 (Informe Global Sobre Turismo Sostenible 2022) Booking.com.
Considering that in 2019, 45 percent of tourism spend in Spain was domestic, Spanish traveler sentiment is particularly relevant to Spain’s tourism offerings, for locals and international tourists alike. 20 Global travel service data from Oxford Economics.
Globally, hospitality providers may be at risk of not meeting customer expectations around sustainability as there is a gap between what consumers want and what exists in the market. An earlier Booking.com survey spanning 30 countries—Spain being one of them—found that one-quarter of accommodation providers had not implemented any sustainability measures; and for those that had, only one-third actively informed their customers about the measures they had taken—and this usually happened at check-out. 21 Sustainable travel report 2021, Booking.com.
Taking action on sustainability (and actively communicating what has been done) could bridge this gap, attract new travelers, and help Spain’s tourism sector to flourish while doing good for local communities and the planet. Much of McKinsey’s research on sustainability shows that doing well and doing good are not mutually exclusive —these actions reinforce each other. Industry-wide commitment to sustainability could help to differentiate the sector, and respond to consumer needs, thereby increasing the chances of economic sustainability.
How sustainability-related initiatives provide a unique experience
Destinations around the world have demonstrated that environmental and social sustainability initiatives can protect resources and promote local communities—and become flagship projects that garner international recognition and draw visitors looking for meaningful and authentic travel experiences.
- A Dutch partnership between national NGOs and local communities created a new way to maintain beaches without threatening biodiversity. The initiative involved locals and tourists and led to a new certification method, a first around the world. In 2021, Goeree-Overflakkee was awarded the first “Green Beach” certification, and in 2022 became known as the cleanest beach in the Netherlands. 1 “Green Destinations top 100 stories 2022: Together for a new standard in biodiverse green beaches,” Green Destinations website.
- The Greek region of Attica was named the world’s leading sustainable tourism destination in 2022 by the World Travel Awards based on its cultural wealth, natural beauty, modern infrastructure, and the comprehensive plan implemented by the region in order to turn Attica into the first “green” region. 2 “World's leading sustainable tourism destination 2022,” World Travel Awards website.
- Visitors to Hiiumaa island in Estonia usually rely on private cars to visit key attractions. To provide visitors with a lower-carbon mobility option and a more authentic, nature-based experience of the island, a local entrepreneur created an electric bicycle network (including solar power loading stations) which has become popular with tourists and locals. 3 “Green Destinations top 100 stories 2022: Carbon neutral and local, new opportunities in tourism and public transport in Estonian’s green island Hiiumaa,” Green Destinations website.
- In Istria, Croatia, around half of tourists stay in small, private accommodation. Eco Domus is a certification program that teaches private accommodation providers sustainability practices on topics including water, food, health, and light and noise pollution. The aim is to provide better quality, and more sustainable, local offerings. 4 “Green Destinations top 100 stories 2022: Eco Domus, eco-friendly accommodation,” Green Destinations website.
Of course, taking action requires time, resources, and investment. Individual hotels or tourism businesses may have little incentive to redefine core offerings or invest in infrastructure to demonstrate that sustainability is important to them. But businesses that begin to differentiate themselves could reap the benefits. Many destinations in the region provide examples of how sustainable offerings can become a drawcard for visitors, and earn international acclaim and prestige (see sidebar “How sustainability-related initiatives can offer tourists a unique experience”).

The path toward eco-friendly travel in China
Actions to advance sustainability across spain’s tourism sector are emerging.
Spain developed a Sustainable Tourism Strategy 2030, a national agenda to help the tourism sector address medium- and long-term challenges including socioeconomic and environmental sustainability. 22 “Sustainable tourism strategy of Spain 2030,” Spain’s Ministry of Industry, Trade and Tourism. Even though this national sustainability strategy is in place, there are limited mechanisms to help small businesses partake and contribute. This is particularly challenging as small- and micro-sized businesses make up the vast majority of all businesses in the country’s tourism sector. According to Statista, micro-size businesses account for around 92 percent of Spain’s travel, tourism, and hospitality businesses. Small businesses make up just over 7 percent, and medium and large businesses account for the remaining half a percent. 23 Statista, Distribution of businesses in the tourism sector in Spain in 2020 by size, June 2022.
This fragmentation can halt progress and collective action, for instance in emissions reduction. Spain’s large hospitality providers are making efforts to reduce carbon emissions, and many are pioneers in the field: Melia opened Menorca’s first carbon-neutral luxury hotel in 2022, showcasing carbon-neutral operations, “intelligent” energy-efficient buildings, and circular models for water resources. 24 Tom Otley, “Melia opens Villa Le Blanc By Gran Meliá in Menorca, Spain,” Business Traveller, July 20, 2022. Iberostar has committed to becoming carbon neutral by 2030—a target that is 20 years ahead of many other international hospitality brands. 25 “Iberostar will be carbon neutral by 2030, 20 years ahead of the industry’s global target,” Iberostar press release, November 8, 2022.
In general, smaller and medium-size providers’ goals and targets are less ambitious than those of international peers, presumably because the economic benefits of such actions are unclear, or they may fear first-mover disadvantages like higher costs. Various Spanish hotel chains have committed to reducing emissions by 20 to 35 percent, with timelines ranging from 2030 to 2035. By comparison, many international brands have committed to net zero by 2050 and have strict measures in place to achieve this.
According to the Greenview Hotel Footprinting Tool, which calculates the carbon footprint of a hotel stay anywhere in the world, Spain is among the best-performing countries in terms of low-carbon room footprint and meeting footprint. While this tool points to a strong focus on water-, waste- and emissions-reduction in Spanish hotels, it is difficult to assess what actions many smaller hotels and other tourism businesses are taking on the sustainability front.
Sustainable tourism in Valencia
Valencia claims to be the first city in the world to track the carbon footprint of all tourism activities in the city and has committed to achieving carbon-neutral tourism by 2025. 1 “Valencia becomes the first city in the world to verify and certify the carbon footprint of its tourist activity,” Valencia Tourism official website, July 10, 2020.
Valencia’s official tourism website features sustainable tourism as a key element and makes sustainable offerings visible. For instance, the website encourages visitors to reduce emissions by taking public transport or traveling by bicycle and to support the local economy by shopping at smaller, local stores. It also offers tips on how to be a “responsible tourist who is committed to the environment at all times” such as using energy and water sparingly, recycling, reducing plastic, and respecting local residents.
In this way, the city has positioned itself as “the city taking care of the planet” and made sustainability its differentiating factor.
Even though there may not be concerted and unified action on social and environmental sustainability across the sector, success stories exist of initiatives being put in place that make sustainability a key differentiator (see sidebar “Sustainable tourism in Valencia”). Sector-wide efforts could increase investment into sustainable offerings, make these more visible to tourists, and ultimately position Spain as the destination of choice for sustainable travel.
How Spain could become a sustainable destination of choice
Individual travel and tourism businesses’ environmental and social sustainability efforts need to achieve critical mass if Spain is to become known as a leading destination for sustainability-conscious travelers. These actions are also vital to preserve the sector’s economic sustainability. Collective and concerted action is required to build momentum. All stakeholders have a role to play in addressing the sector’s rationale for action, setting a clear course, and developing the support structure to achieve it.
Identify the value at stake. The sector could take a high-level view to evaluate the status quo, benchmark where Spain could be, and quantify the costs and benefits of prioritizing sustainability throughout the sector, at scale. All stakeholders including policy makers, government, and industry could jointly develop a sustainable travel concept for the sector with a clearly articulated justification for action.
Costa Rica provides an example of a national tourism strategy focused on sustainability. The industry is aligned with national objectives to protect the country’s forests and biodiversity. National parks, nature reserves, and protected areas make up around one-quarter of Costa Rican territory and the sector promotes ecotourism and sustainable offerings that support the conservation of these areas. 26 “Costa Rica, a country committed to the environment,” Aquae Fundacion, July 6, 2021.
Spain’s stakeholders could also agree on industry-wide standards, as having these in place would likely accelerate the transition to sustainable tourism. Standards that align the motivations of different stakeholders and take into account the interests of all parties have a greater chance of adoption. For example, including mandatory sustainability criteria in the hotel star rating system could bring the motivations of hotel owners and operators into alignment. 27 “The path toward eco-friendly travel in China,” McKinsey, March 14, 2023. Setting unified sector sustainability targets could also boost the credibility of sustainability claims or commitments made by individual businesses.
Define a strategy. This includes establishing initiatives to address specific concerns such as decarbonization, water usage, waste management, or overcrowding and setting targets and practical actions to achieve them. For instance, one initiative in Costa Rica—as part of its conservation effort—is a ban on single-use plastic in national parks, biological reserves, and national monuments. 28 “Costa Rica, a country committed to the environment,” Aquae Fundacion, July 6, 2021.
In another example, Iceland set a strategy to reduce seasonality—a long-standing challenge for Icelandic tourism. In 2010, close to half of travelers visited the country during the summer months of June, July, or August. The travel industry, with support from the government and others, launched an international marketing campaign to promote Iceland as a year-round destination. Winter activities such as viewing the Northern lights, snowmobiling, and glacial treks became popular with visitors. Between 2010 and 2019 the share of tourists that visited in summer fell from around 50 to 34 percent, while tourist arrivals continued to grow. 29 Icelandic Tourist Board, Isavia, visitor departure statistics.
Once the strategic direction is set, sector-wide initiatives can be put in place. In New Zealand, a collaborative and concerted effort involving public and private organizations gave rise to the Tiaki Promise, a pledge that encourages visitors to take care of the country’s natural resources: “While traveling in New Zealand, I will care for land, sea, and nature, treading lightly and leaving no trace; travel safely, showing care and consideration for all; and respect culture, traveling with an open heart and mind.” One collaborator in the initiative, Air New Zealand, released an in-flight safety video that introduced the promise to travelers. 30 Kresentia Madina “The Tiaki Promise encourages tourists to care for New Zealand’s nature,” Green Network, August 26, 2022.
It is also important to rank individual measures to address challenges to ensure that competing priorities do not hinder progress. Collective action will have the most impact if all stakeholders are committed to the same issues.
Many travel and tourism businesses across the world have developed and successfully marketed sustainable products and services, such as low-impact tourist offerings that are less harmful to the environment or local communities. In fact, many travel guides publish editions dedicated to sustainable offerings. 31 Examples include Fodor’s Green Travel: The world’s best eco-lodges and earth-friendly hotels and Lonely Planet’s The sustainable travel handbook . Spain’s tourism providers could follow suit. And the sector could make travelers more aware of existing sustainable travel options through communications campaigns to draw sustainability-conscious travelers from across the globe.
Travel and tourism businesses could also extend sustainability efforts across their value chains. Examples include working with suppliers to ensure linen and towels are sustainably produced, procuring energy-efficient equipment, or engaging local communities by sourcing local food suppliers. There are also opportunities for businesses to collaborate and design sustainable offerings that combine products and services, such as sustainability-focused tours featuring carbon-neutral accommodation, electric ground transportation, and trips to local businesses.
Globally, hotel chains have partnered with sustainability-related businesses or action groups to advance their own sustainability initiatives. These actions also help to strengthen the hotel’s brand and reputation for sustainability consciousness. For instance, the luxury hotel, resort, and spa operator Six Senses partnered with the United States Coalition on Sustainability and the action platform SustainChain in an initiative to remove single-use and disposable plastics from its operations. 32 “Six Senses is the first hospitality brand to partner with the United States Coalition on Sustainability and SustainChain,” Six Senses press release, April 26, 2021. And as part of its pathway to net zero, the Radisson Hotel Group partnered with Ecovadis, a sustainability ratings provider, in a collaboration that aims to extend the EcoVadis rating to the group’s global supply chain. 33 “Radisson Hotel Group increases focus on supply chain sustainability; announces partnership with Ecovadis,” Radisson Hotel Group press release, December 16, 2021.
Spanish tourism and hospitality providers might consider similar collaborative partnerships and initiatives to build momentum for industry-wide action and raise global travelers’ awareness that Spain is committed to sustainability.
Provide guidelines and support. Smaller businesses may lack the knowledge or resources necessary to act on sustainability. Actions could be taken to bridge knowledge gaps and secure funding, at government or industry association level. Funding programs, incentive schemes, or financial instruments can accelerate adoption of sustainable solutions, especially for smaller businesses. For example, South Africa’s Green Tourism Incentive Program targets small tourism businesses like lodges and guest houses. The program funds water- and energy-efficiency assessments and recommends the optimum green solution for the business. The bulk of the cost to implement the solution is also funded by the program. 34 “The Green Tourism Incentive Programme,” Industrial Development Corporation, October 4, 2021.
The industry could also draw on available resources and convene stakeholders to share knowledge and expertise. For instance, the World Tourism Organization provides resources and guidelines for building a circular economy, reducing food waste, and tackling plastic pollution. 35 “Sustainable development,” UNWTO website.
Regulation could be put in place to support change. Regions or cities could look to establish regulations that ensure tourism activity is environmentally and socially sustainable. Progress has been made in this regard, as the Law on Circularity and Sustainability in Tourism, approved by Parliament in May 2022, made the Balearic Islands the first sustainable destination by law. 36 “Balearic Islands, sustainable tourism is now a law,” Excellence Magazine, June 21, 2022. This regulation protects seasonal tourism workers, considers local residents’ quality of life (for instance by blocking an increase in the number of beds for the next four years), reduces waste, and protects natural resources. It will also introduce a hotel classification system based on the concrete actions taken to promote sustainable tourism.
Regulatory bodies and industry associations could also support business owners with guidance, encourage implementation through incentives, and enforce regulations through penalties for non-compliance.
Spain’s tourism sector has an opportunity to further develop existing sustainability efforts, thereby protecting the future of the sector. A sector-wide focus on environmental and social sustainability can also act as a key differentiator and draw visitors who are consciously trying to travel more responsibly. Furthermore, all stakeholders could benefit if existing initiatives, and new investments, are made more visible and attractive to tourists.
Javier Caballero is a partner in McKinsey’s Madrid office, Margaux Constantin is a partner in the Dubai office, Steffen Köpke is a capabilities and insights expert in the Düsseldorf office, and Daniel Riefer is a partner in the Munich office.
The authors wish to thank Lisa Kropacek for their contribution to this article.
Explore a career with us
Related articles.

Has COVID-19 changed tourism in Spain? Experts have identified three types of tourist

Experts predict a continuing trend of mass and sun- and beach-based tourism for summer 2022 (Photo: jlxp / Pixabay)
The COVID-19 pandemic has upset a huge variety of activities and situations worldwide since it first emerged in early 2020. One of the industries most harshly affected by it has been tourism, as a result of restrictions on flights and mobility and people's reluctance to travel for health reasons, all of which have resulted in a significant reduction in tourism in the last two years.
A study conducted by researchers at the Universitat Oberta de Catalunya (UOC), and published in the open-access Journal of Tourism Futures, has looked at the impact of people's perceived health risk of travelling immediately after the first wave of COVID-19 and lockdown and identified various tourist profiles and their motivations.
"The experience of the pandemic has led to a variety of reactions affecting people's behaviour as tourists. Some people seem to want to make changes to their consumption habits and the way they do tourism, whereas others have not done this at all or have only done so in a very superficial manner," said Francesc González Reverté , a member of the UOC's Faculty of Economics and Business and New Perspectives on Tourism and Leisure ( NOUTUR ) research group, who led the study together with UOC researchers Joan Miquel Gomis López and Pablo Díaz Luque .
Tourist profiles
According to the authors of the study, there are three profiles of tourists who want to change their future tourism habits and behaviour in terms of the way they organize trips and decide when and how to visit certain places. The first profile is that of the concerned tourist . Members of this category assert that they want to change the way they live, and therefore the way they travel, after the pandemic.
The second profile is that of the pragmatic tourist . People in this category are sensitive to the risk of tourism but are not willing to make serious changes to the way they travel. "Tourists in this category only change their behaviour temporarily, for the duration of the pandemic," said González Reverté.
Finally, sceptical tourists are those who do not want to change either their travel habits or their behaviour. They do not appear to be risk-averse and state that they want to keep travelling to mass tourism destinations.
These profiles were drawn up based on 500 interviews conducted with Spanish tourists in spring 2020, after the first wave of COVID-19 and lockdown, early on in the pandemic, when there were no vaccines. The set of interviewees was composed of 33.7% men and 66.3% women, all of them in the 35-45 and 46-54 age ranges. As to educational background, at the time of the survey 53.5% of respondents had finished secondary school, and 33% had a degree. Furthermore, 79% were working, and 21% were unemployed.
The study also found that people have reacted in very different ways regardless of whether or not they have had the disease themselves. González explained that "We were surprised to find no direct correlation between having been affected by the disease, either personally or through close contacts, and a change in behaviour in tourism or general living habits."
Short-term tourism trends
Although coronavirus diseases, among others, are transmitted faster in this globalized world, particularly in highly populated areas, the authors noted that the behavioural change of some tourists has been very "short-lived". "Although the pandemic has led to an intellectual debate revolving around the new global consciousness of our insignificance as a species, the results of the study suggest that there is no general fear of continuing to travel in the future or any intention of radically changing the way we do so," said González.
In fact, the UOC researchers emphasized that risk perception is a social construct and is therefore not sufficient in itself to make people change unless it is coupled with other measures, such as education or awareness-raising actions. Furthermore, behavioural changes "are more based on factors such as environmental attitudes or individual people's pre-existing worldviews," they noted.
Although there was talk of a change in tourism habits and preferences shortly after the early waves, such as a greater trend towards nature tourism or visiting the countryside, the study has shown that there is a significant number of tourists who will continue to rely on traditional sun- and beach-based mass tourism destinations in the long term . "A significant majority of tourists don't associate going to these very busy places with a higher risk of catching the disease. Furthermore, they often perceive them as safe," said the UOC researcher.
This finding challenges the idea that mass tourism destinations "were going to be the big losers" . Although the fall in tourism initially resulted in losses of millions of euros for the industry, we are now moving away from the trend that led to the idea that mass tourism was "going to disappear". For example, the initial visitor forecasts for summer 2022 confirm a continuing trend in this type of mass tourism.
"Although our contributions are clear, we need many more empirical studies to provide new data in order to effectively measure the effect of the pandemic on various aspects of tourist behaviour," concluded González. He also noted that, although many articles about the link between COVID-19 and tourism have been written, their approach is usually theoretical or based on the author's personal opinion or mere speculation, without any field work-based data or information.
This UOC research supports Sustainable Development Goals (SDG) 8, Decent Work and Economic Growth; and 12, Responsible Consumption and Production.
González-Reverté, F. , Gomis-López, J. M. and Díaz-Luque, P. (2022 ), "Reset or temporary break? Attitudinal change, risk perception and future travel intention in tourists experiencing the COVID-19 pandemic" , Journal of Tourism Futures , vol. ahead-of-print, no. ahead-of-print. https://doi.org/10.1108/JTF-03-2021-0079
UOC R&I
The UOC's research and innovation (R&I) is helping overcome pressing challenges faced by global societies in the 21st century, by studying interactions between technology and human & social sciences with a specific focus on the network society, e-learning and e-health .
Over 500 researchers and 51 research groups work among the University's seven faculties and two research centres : the Internet Interdisciplinary Institute ( IN3 ) and the eHealth Center ( eHC ).
The University also cultivates online learning innovation s at its eLearning Innovation Center ( eLinC ), as well as UOC community entrepreneurship and knowledge transfer via the Hubbik platform.
The United Nations' 2030 Agenda for Sustainable Development and open knowledge serve as strategic pillars for the UOC's teaching, research and innovation. More information: research.uoc.edu #UOC25years
Experts UOC
Press contact.
- Editorial department [email protected] 93 253 23 00
You may also be interested in…
Most popular, related courses.
Travel, Tourism & Hospitality
Tourism sector in Spain - statistics & facts
Who visits spain the most, how popular is domestic tourism in spain, key insights.
Detailed statistics
Quarterly travel and tourism balance of payments in Spain 2018-2022
Tourism premises in Spain 2015-2021
Tourism employment in Spain 2020-2021
Editor’s Picks Current statistics on this topic
Current statistics on this topic.
Inbound tourism volume in Spain 2022, by origin
Tourism contribution to Spanish GDP 2006-2023
Destinations
Inbound tourism volume in Spain 2022, by region of destination
Related topics
Tourism in spain.
- Inbound tourism in Spain
- National tourism in Spain
- Tourism in Barcelona
- Travel and tourism in the Canary Islands
Tourism in Europe
- Travel and tourism in Europe
- Backpacking in Europe
- Wine tourism in European countries
- Cruise industry in Europe
- Overtourism in European destinations
Travel trends
- Subscription model in the travel industry
- Mobile travel trends
- Travel and tourism in the metaverse
- Artificial intelligence (AI) use in travel and tourism
Recommended statistics
- Premium Statistic Leading European countries in the Travel & Tourism Development Index 2021
- Premium Statistic Tourism contribution to Spanish GDP 2006-2023
- Premium Statistic Tourism sector as share of GDP in Spain 2010-2021
- Premium Statistic Monthly growth rate of tourism GDP in Spain 2022
- Premium Statistic Tourism employment in Spain 2015-2021
- Premium Statistic Tourism employment in Spain Q4 2022, by industry
Leading European countries in the Travel & Tourism Development Index 2021
Leading European countries in the Travel & Tourism Development Index (TTDI) in 2021
Contribution of the tourism sector to the gross domestic product in Spain from 2006 to 2022, with a forecast for 2023 (in billion euros)
Tourism sector as share of GDP in Spain 2010-2021
Contribution of tourism to gross domestic product in Spain from 2010 to 2021
Monthly growth rate of tourism GDP in Spain 2022
Percentage change in the contribution of travel and tourism to GDP in Spain from January to December 2022
Tourism employment in Spain 2015-2021
Number of employees in the tourism sector in Spain from 2015 to 2021 (in 1,000s)
Tourism employment in Spain Q4 2022, by industry
Number of people working in the tourism sector in Spain in 4th quarter 2022, by industry (in 1,000s)
Tourism volume and expenditures
- Premium Statistic Inbound visitors in Spain 2000-2022
- Premium Statistic Inbound tourism volume in Spain 2022, by origin
- Premium Statistic International tourism spending in Spain 2012-2022
- Premium Statistic Domestic trips in Spain 2015-2022
- Premium Statistic Domestic trips in Spain 2022, by destination
- Premium Statistic Domestic tourism spending in Spain 2015-2022
- Basic Statistic Share of travel and tourism spending in Spain 2022, by traveler origin
Inbound visitors in Spain 2000-2022
Number of international visitors in Spain from 2000 to 2022 (in millions)
Number of international tourists in Spain in 2022, by country of residence (in 1,000s)
International tourism spending in Spain 2012-2022
Expenditure of international tourists in Spain from 2012 to 2022 (in billion euros)
Domestic trips in Spain 2015-2022
Number of domestic trips in Spain in 2015 to 2022 (in millions)
Domestic trips in Spain 2022, by destination
Number of domestic trips in Spain in 2022, by autonomous community of destination (in millions)
Domestic tourism spending in Spain 2015-2022
Expenditure of domestic tourists in Spain from 2015 to 2022 (in billion euros)
Share of travel and tourism spending in Spain 2022, by traveler origin
Distribution of expenditure by tourists in Spain in 2022, by main origin
- Premium Statistic Inbound tourism volume in Spain 2022, by travel reason
- Premium Statistic Domestic trips in Spain 2022, by travel reason
- Basic Statistic Share of travel and tourism spending in Spain 2022, by purpose
- Premium Statistic Inbound trips for cultural purposes to Spain 2010-2022
- Premium Statistic Number of enotourists in Spain 2008-2022
- Premium Statistic Number of skiers and snowboarders in Spain 2010-2022
- Premium Statistic Pilgrims on the Way of Saint James 2011-2022
Inbound tourism volume in Spain 2022, by travel reason
Number of international tourists in Spain in 2022, by travel purpose (in 1,000s)
Domestic trips in Spain 2022, by travel reason
Number of domestic trips in Spain in 2022, by travel purpose (in millions)
Share of travel and tourism spending in Spain 2022, by purpose
Distribution of expenditure by tourists in Spain in 2022, by main travel purpose
Inbound trips for cultural purposes to Spain 2010-2022
Number of trips for cultural reasons made by international tourists to Spain from 2010 to 2022 (in 1,000s)
Number of enotourists in Spain 2008-2022
Number of visitors to wineries and wine museums in Spain from 2008 to 2022 (in 1,000s)
Number of skiers and snowboarders in Spain 2010-2022
Number of visitors to ski resorts in Spain from 2010/2011 to 2021/2022 (in 1,000s)
Pilgrims on the Way of Saint James 2011-2022
Number of pilgrims who traveled to Santiago de Compostela, Spain from 2011 to 2022
- Premium Statistic Tourism premises in Spain 2015-2021
- Premium Statistic Share of tourism companies in Spain 2021, by size
- Premium Statistic Main hotel groups in Spain FY2021, by sales revenue
- Premium Statistic Main passenger airlines in Spain 2022
- Premium Statistic Main travel agencies in Spain FY2021, by sales revenue
- Premium Statistic Main restaurants and food stall companies in Spain FY2021, by sales revenue
- Premium Statistic Ecotourism businesses' average revenue in Spain 2022, by type
Number of establishments in the tourism sector in Spain from 2015 to 2021
Share of tourism companies in Spain 2021, by size
Distribution of businesses in the tourism sector in Spain in 2021, by size
Main hotel groups in Spain FY2021, by sales revenue
Leading hotel companies in Spain in FY2021, based on sales revenue (in million euros)
Main passenger airlines in Spain 2022
Leading airlines in Spain in 2022, based on number of passengers (in millions)
Main travel agencies in Spain FY2021, by sales revenue
Leading travel agencies in Spain in FY2021, based on sales revenue (in million euros)
Main restaurants and food stall companies in Spain FY2021, by sales revenue
Leading restaurant and food stall companies in Spain in FY2021, based on sales revenue (in million euros)
Ecotourism businesses' average revenue in Spain 2022, by type
Average revenue of ecotourism establishments in Spain in 2022, by type (in 1,000 euros)
Main destinations
- Premium Statistic Main coastal destinations in Spain 2022, by number of hotel guests
- Premium Statistic Most visited cities in Spain 2022
- Premium Statistic Attendance to Spanish National Heritage sites 2022
- Premium Statistic Attendance to Spanish national parks 2022
- Premium Statistic Cruise ship calls at Spanish ports 2022, by authority
- Premium Statistic Enotourism destination areas in Spain 2022, by region
Main coastal destinations in Spain 2022, by number of hotel guests
Leading beach destinations in Spain in 2022, based on number of overnight tourists in hotels (in 1,000s)
Most visited cities in Spain 2022
Leading city destinations in Spain in 2022, by number of tourists (in 1,000s)
Attendance to Spanish National Heritage sites 2022
Number of visitors to National Heritage sites in Spain in 2022 (in 1,000s)
Attendance to Spanish national parks 2022
Number of visitors to national parks in Spain in 2022 (in 1,000s)
Cruise ship calls at Spanish ports 2022, by authority
Number of cruise vessels calling at ports in Spain in 2022, by port authority
Enotourism destination areas in Spain 2022, by region
Number of Wine Routes in Spain in 2022, by autonomous community
Online travel market
- Premium Statistic Quarterly online revenue of accommodation businesses in Spain 2014-2022
- Premium Statistic Quarterly online revenue of travel agencies & tours operators in Spain 2014-2022
- Premium Statistic Airbnb revenue in Spain 2015-2020
- Premium Statistic Willingness to purchase tourism services online in Spain 2019-2022
- Premium Statistic Average spend on tourism services booked online in Spain 2018-2022
- Premium Statistic Hotel / private accommodation online bookings by brand in Spain 2023
Quarterly online revenue of accommodation businesses in Spain 2014-2022
E-commerce revenue of hotels and similar establishments in Spain from 1st quarter 2014 to 4th quarter 2022 (in million euros)
Quarterly online revenue of travel agencies & tours operators in Spain 2014-2022
E-commerce revenue of travel agencies and tour operators in Spain from 1st quarter 2014 to 4th quarter 2022 (in million euros)
Airbnb revenue in Spain 2015-2020
Revenue of Airbnb in Spain in 2015, 2019, and 2020 (in million euros)
Willingness to purchase tourism services online in Spain 2019-2022
Share of individuals who intended to buy travel products and services online in Spain from 2019 to 2022
Average spend on tourism services booked online in Spain 2018-2022
Average spend on travel products and services bought online in Spain from 2018 to 2022 (in euros)
Hotel / private accommodation online bookings by brand in Spain 2023
Hotel / private accommodation online bookings by brand in Spain as of December 2023
Further reports Get the best reports to understand your industry
Get the best reports to understand your industry.
Mon - Fri, 9am - 6pm (EST)
Mon - Fri, 9am - 5pm (SGT)
Mon - Fri, 10:00am - 6:00pm (JST)
Mon - Fri, 9:30am - 5pm (GMT)
Spain Travel Stories
Mar 13, 2024 • 7 min read
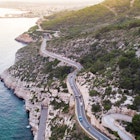
Set out for history, natural beauty and delicious flavors on these five road-trip itineraries, which will show you the best of Spain.

Mar 7, 2024 • 10 min read
There are so many incredible experiences awaiting you in Spain. Here are some of the very best.

Feb 13, 2024 • 7 min read
There are so many incredible attractions in Spain it can be hard to know where to begin. Start your shortlist here with the top 8 places to visit in 2024.

Nov 30, 2023 • 3 min read
You’ve booked your trip to Spain. The only thing left to do is pack your bags and we're here to help you decide what to take, and what to leave behind.

Nov 7, 2023 • 7 min read
Everything you need to know from when to go and what to do, to how much to budget for, on a trip to the up-and-coming Murcia region of Spain.

Oct 20, 2023 • 5 min read
Of all the places to travel with children, Spain is up there with the best of them. Here are some of the best things to do with kids in this dynamic country.
Sep 30, 2023 • 4 min read
Planning with a local expert from Elsewhere by Lonely Planet made our family trip to Spain unforgettable.

Sep 25, 2023 • 8 min read
Spain is one of the world’s top gastronomic playgrounds, and this goes double at festival time. Here are the country's top food festivals.

Sep 5, 2023 • 10 min read
Spain is a hikers paradise - and there's a wide variety to explore from day walks through canyons to the Camino Primitivo.

Aug 31, 2023 • 10 min read
There are many stunning hikes to do in Spain's Andalucía from day walks with children to bagging a summit or slowing down on a multi-day hike.

Jul 26, 2023 • 6 min read
Compared to the rest of Europe, Spain is easy on the eyes and even easier on the wallet. Here are the best ways to save money while you're there.

Jul 13, 2023 • 5 min read
We asked four travel writers about the their favorite under-the-radar vacation spots in their native Spain.

Jul 10, 2023 • 7 min read
You’ve probably never been to Spain’s Cíes Islands, but we have a lot of reasons why you should. Here's what you need to know.

Jul 10, 2023 • 4 min read
From the liveliest events to when you'll find the best weather, here's when to visit Spain.

Jul 7, 2023 • 4 min read
Don't let your visa application mess up your trip to Spain. Here's everything you need to know about whether you need one.

Jun 26, 2023 • 5 min read
Traveling around Spain is convenient, efficient and manageable — thanks to its advanced and accessible public transport infrastructure.

Jun 21, 2023 • 6 min read
From speaking Spanish to avoiding common tourist mistakes, this guide full of top tips can get you ready for a trip to Spain.

Jun 6, 2023 • 7 min read
Lonely Planet’s Amy Lynch recently took the new ferry route from southeast Ireland to northern Spain. Here’s her report.

May 16, 2023 • 6 min read
With Santiago de Compostela in sight, the best part of the Camino Portugués may require you to take a detour.

May 12, 2023 • 5 min read
Spain has an unmatched lineup of unique summertime festivals. Here are the best to experience in 2023.
May 5, 2023 • 7 min read
A new train line takes riders through lesser-known regions of northern Portugal and Spain with an intriguing Celtic heritage.

Apr 21, 2023 • 5 min read
It takes a few transfers to get between the two Iberian capitals by train. And they’re worth it.
Spain’s tourism renaissance will drive economic growth this year
The recovery of the tourism sector in Spain is expected to continue, putting the industry at the centre of economic growth this year. However, due to macroeconomic uncertainty, high price pressure in the sector and lagging long-haul travel, it may take until 2024 for the number of international visitors to return to pre-pandemic levels

Spain's tourism revival expected to continue despite macroeconomic challenges
Despite macroeconomic challenges, Spain's tourism sector rebounded strongly in 2022. The country saw a remarkable increase in the number of international visitors, rising by 130% from 31.2 million in 2021 to 71.6 million in 2022, showing a strong appetite to travel again after two years of strict travel restrictions. Although disposable income was under severe pressure in many European countries last year, consumers refused to cut back on their travel spending. That being said, the number of international tourists entering Spain still remained 14% below pre-pandemic levels, proving that there is still a long way to go to full recovery.
Number of international visitors entering Spain, in absolute values and as % of 2019 levels
Challenges on the horizon: factors hindering the growth of international tourism in spain.
There are several factors that could hamper the growth of international tourism. One is that for Spain's main source countries, the UK and Germany, which accounted for 22% and 13% of international visitors in 2019 respectively, the economic outlook looks bleak. In the UK, the cost-of-living crisis has hit hard and we expect the UK economy to grow by only 0.2% this year. Meanwhile, the German economy has contracted over the past two quarters and is officially in a technical recession. We expect economic growth in Germany to stagnate this year. While the sharp fall in purchasing power is not currently deterring Europeans from travelling, it could cause price-sensitive travellers to swap Spain for cheaper destinations.
Unfavourable exchange rates are also encouraging British travellers to choose Turkey over southern European countries including Spain. A recent report by the European Travel Commission showed that Turkey had 69% more arrivals from the UK in the first quarter of this year than in 2019, while the number of arrivals in Spain was lower than in 2019. This shift in preference can be attributed to the significant price difference. The depreciation of sterling against the euro, combined with the continued devaluation of the Turkish lira against the euro, has made travelling to Turkey much more affordable for British tourists than visiting southern European countries such as Spain.
Another factor hampering recovery is the current travel restrictions on Russian travellers. In 2019, Spain welcomed 1.3 million visitors from Russia, accounting for about 1.6% of total tourist arrivals. This particular group of visitors will be completely absent in 2023. And Spain will not get a boost from Chinese tourism this year either. Although Chinese tourists are eager to travel again, they are favouring domestic trips or visits to neighbouring countries. The number of Chinese tourists visiting Spain was relatively modest even before the pandemic: about one million Chinese tourists travelled to Spain in 2019, which was only 1.3% of the total number of visitors that year.
Business travel to Spain bounces back to pre-pandemic levels
Spain is witnessing a remarkable recovery in business travel after the sharp decline during the pandemic. In the first quarter of 2023, the number of international business travellers increased by 48% compared to the same period last year, returning to pre-pandemic levels. Business travellers represent a significant proportion of the total number of visitors. In 2019, 5.4 million foreign visitors visited Spain for professional reasons, or 6.5% of the total number of foreign visitors in 2019. This means that more than one international arrival in 20 comes to Spain for business reasons.
Last year, business travel recovered more slowly than leisure travel. Due to the shift online during the pandemic, many companies became more selective about the necessity and frequency of business travel, opting more for digital meetings or conferences. In addition, economic uncertainty and the energy crisis also caused a pullback in business travel at the turn of the year. While business travel was already at 96% of its pre-crisis level in October 2022, it fell to 74% in December as many companies adopted cost-saving measures and reduced their travel budgets.
Business travel has been steadily catching up since the beginning of this year. The Spanish economy has recovered strongly from the energy crisis, growing by 0.5% in the first quarter, and business confidence has returned. In March, the number of international business travellers was already back to 94% of the 2019 level. We expect that the recovery will persist throughout this year, resulting in half a million additional business travellers visiting Spain compared to 2022. Towards the end of the year, however, we might see a slight decline again if the pace of recovery slows and the US economy falls into recession.
Number of international visitors coming to Spain for professional reasons, in % of their number in 2019
Outlook for international travel in 2023.
Despite the headwinds, the first months of 2023 already showed a promising start for international tourism in Spain this year. In the first quarter, the number of foreign visitors reached 97% of pre-pandemic levels. Falling energy prices and stable labour market conditions may have underpinned the tourism sector. If this trend continues into the summer peak, it is likely that tourism figures in the summer months could match or even exceed 2019 levels for the first time.
The recovery in international travel is expected to continue into 2023, albeit at a slower pace than last year. The tourism sector is benefiting from continued strong travel appetite and a slightly improved economic outlook, thanks to a sharp fall in energy prices. However, persistent macroeconomic concerns will slow the pace of recovery, especially in the second half of this year. All in all, we expect a total of 80.7 million tourists to visit Spain in 2023, up by 13% from the previous year but still 3% below the pre-pandemic level. It will probably take until 2024 for the annual number of international tourists to reach 2019 levels again.
Number of international visitors entering Spain each year, including ING forecast (in millions)
Inflationary challenges in the tourism sector remain elevated.
Inflation in the tourism sector remains stubbornly high, with significant pressure on all tourism activities. The consumer price index (CPI) for tourism and hospitality, a specific category within the broader index measuring price changes for tourism and hospitality-related goods and services, stood at 8.1% in April. This figure is just slightly below the peak level of 8.5% recorded in August 2022. Since the start of the pandemic, prices for tourism products and services have risen by an average of 16%.
Inflationary pressures can be attributed to two main factors. First, there are general inflationary pressures due to the increased cost of labour, raw materials and other inputs, which are passed on to consumers. In addition, sustained high demand and consumers' increased willingness to spend on travel and accommodation have given travel and accommodation providers greater pricing power. This allows them to capitalise on this higher demand by raising prices more easily.
Price pressures in the tourism sector show no signs of cooling yet
Increased price levels also have negative consequences. They may lead to a drop in domestic demand, especially among price-conscious travellers or those with limited disposable income. Moreover, potential international visitors may opt for alternative destinations that offer similar travel experiences at more affordable prices. Those who still visit Spain will adjust their spending patterns to mitigate the impact of high prices.
In March, foreign tourists spent an average of €168 per day, up 7% from March 2022. However, given average inflation of 8.1% in the tourism sector, this equates to a 1% drop in real spending. It seems that, in order to cope with significant price increases, visitors are cutting back on certain expenses, such as choosing cheaper accommodation, budget-friendly restaurants and cost-effective activities. In addition, many travellers shorten their trips as another effective strategy to reduce overall travel costs. While the average duration of a trip was 8.0 days in March last year, it has now dropped to 7.6 days.
Tourism will be the main catalyst for economic growth this year
Tourism is a significant contributor to Spain's GDP. According to data from the World Travel and Tourism Council (WTTC), for the year 2019, tourism represented 12.4% of Spain's GDP. This includes the direct impact of sectors such as accommodation, catering, transport and tourist attractions. Taking into account indirect effects as well, tourism's total contribution to Spanish GDP reached 15.2%.
Further recovery of the tourism sector will play a central role in the country’s growth this year. After a significant decline during the pandemic, Spanish tourism could further restore its importance to the Spanish economy. With household consumption declining and expected interest rate hikes dampening investment dynamics, tourism will be a key driver of growth this year. Our forecast is for growth of 1.9% for Spain, surpassing the eurozone's expected growth rate of 0.5%.
- Election 2024
- Entertainment
- Newsletters
- Photography
- Personal Finance
- AP Investigations
- AP Buyline Personal Finance
- Press Releases
- Israel-Hamas War
- Russia-Ukraine War
- Global elections
- Asia Pacific
- Latin America
- Middle East
- Election Results
- Delegate Tracker
- AP & Elections
- March Madness
- AP Top 25 Poll
- Movie reviews
- Book reviews
- Personal finance
- Financial Markets
- Business Highlights
- Financial wellness
- Artificial Intelligence
- Social Media
Don’t let it flow: Tourists to Spain’s Catalonia may soon see water restrictions in the dry season
FILE - Joan Torrent, 64, walks toward his house carrying two plastic jugs of water refilled at a natural spring in Gualba, about 50 km, (31 miles) northwest of Barcelona, Spain, Wednesday, Jan 31, 2024. Spain’s drought-stricken northeastern Catalonia is considering imposing water restrictions on tourists in the driest parts of the region if domestic consumption is not curtailed, the Catalan government said Tuesday April 16, 2024. (AP Photo/Emilio Morenatti, File)
- Copy Link copied
BARCELONA, Spain (AP) — Spain’s drought-stricken northeastern Catalonia is considering imposing water restrictions on tourists in the driest parts of the region if domestic consumption is not curtailed, the Catalan government said Tuesday.
The restriction of 100 liters (26 gallons) per tourist per day for hotels would go into effect if a municipality fails to keep domestic water use by residents below established limits for three consecutive months under the current “drought emergency” for Catalonia, officials said.
Barcelona, Spain’s second largest city and the regional capital, uses 160 liters of water per resident per day — well below the current limit of 200 liters, Catalonia’s water agency said. That includes uses by residents for both washing and drinking.
Tourism represents nearly 12% of Spain’s economy. But there has been growing pressure by water conservationist groups to limit the use of water by tourists during the drought.
According to Barcelona’s hotel guild, the average tourist to Barcelona in 2022 used some 163 liters per day, while the figure rose to over 240 liters for luxury hotels.
The limits for tourists would not include the water used to fill swimming pools.
Also Tuesday, the Catalan government loosened restrictions that prohibited the filling of swimming pools with fresh water. Under the new measure, a privately-owned swimming pool can be refilled in a severe drought if authorities declare it a “climate refuge” open to residents seeking relief from the heat.
The regional government also made modifications to its drought restrictions to allow for the private use of desalination installations, a move hotel owners have demanded.
Catalonia has borne the brunt of a drought driven by climate change that has also impacted parts of southern Spain, though a wet spring this year has helped the situation . The reservoirs for Barcelona and surrounding areas that were at 15% of their capacity are now 18% full.
Even so, Catalonia has kept in place its restrictions under a water emergency declared in February to combat a drought regional authorities call historic. Those limitations include reducing average water use by 80% for crop irrigation, 50% for herd animals and 25% for industry.
Read more of AP’s climate coverage at http://www.apnews.com/climate-and-environment
Tourism in Spain
The most popular destinations in spain, development of the tourism sector in spain from 1995 to 2021.

Revenues from tourism

All data for Spain in detail

A cluster analysis of tourist attractions in Spain: Natural and cultural traits and implications for global tourism
European Journal of Management and Business Economics
ISSN : 2444-8494
Article publication date: 13 April 2018
Issue publication date: 17 October 2018
Natural and cultural tourism are important motivators for international tourism. Spain has impressive tourist attractions that are outstanding on the natural and cultural tourism dimensions. The purpose of this paper is to identify traits of the most attractive destinations in Spain and to understand the relative importance of natural, cultural, and dual (natural and cultural) attractions to target consumers.
Design/methodology/approach
The authors compare the level of tourism in the 17 major regions of Spain and identify the key natural, cultural, and dual attractions using a two-step cluster analysis to ascertain the relative importance of the three types of attractions.
The findings of the cluster analysis suggest that natural attractions had the highest importance, followed by dual attractions, with cultural attractions having the lowest importance in affecting the level of tourism in a region. The study identified four categories of regions resulting from “high vs low” total number of attractions by “high vs low” levels of tourism (operationalized via the number of tourist-nights). The regions with high levels of tourism were either located in the bodies of water (a group of islands) or on ocean/sea(s) surrounding Spain. The study suggests placing greater emphasis on promoting cultural attractions in Spain.
Practical implications
The findings suggest that there is a need to put more emphasis on promoting the cultural attractions in Spain. Spain is a diverse country with huge potential for tourism from people all over the world, due to its diverse geography and rich history.
Originality/value
To the best of the authors’ knowledge, this is the first study that analyzes 17 regions of Spain in relation to their tourism characteristics, identifying attractions that are not sufficiently leveraged, and suggesting strategies for identifying opportunities for the tourism industry in Spain.
- Cultural attractions
- Dual attractions
- Natural attractions
- Tourist attractions
Lascu, D.-N. , Manrai, L.A. , Manrai, A.K. and Gan, A. (2018), "A cluster analysis of tourist attractions in Spain: Natural and cultural traits and implications for global tourism", European Journal of Management and Business Economics , Vol. 27 No. 3, pp. 218-230. https://doi.org/10.1108/EJMBE-08-2017-0008
Emerald Publishing Limited
Copyright © 2018, Dana-Nicoleta Lascu, Lalita A. Manrai, Ajay K. Manrai and Allison Gan
Published in European Journal of Management and Business Economics . Published by Emerald Publishing Limited. This article is published under the Creative Commons Attribution (CC BY 4.0) licence. Anyone may reproduce, distribute, translate and create derivative works of this article (for both commercial and non-commercial purposes), subject to full attribution to the original publication and authors. The full terms of this licence may be seen at http://creativecommons.org/licences/by/4.0/legalcode
1. Introduction
In 2016, the travel and tourism industry supported the global economy with 10.2 percent of global gross domestic product; this industry provided $7.6 trillion to the global economy and generated 292 million jobs. In 2016, these tourism-related jobs accounted for 10 percent of the jobs in entire world ( World Travel and Tourism, 2017 ). These figures are projected to grow even more over the next decade, and hold great potential for countries to generate economic growth, job creation, and develop nationally and regionally. International tourist arrivals were at 68.5 million in 2017, and that number is only projected to see more and more growth.
In Spain, tourism accounts for 5 percent of GDP and is a key economic sector; the industry employs one in ten of the workforce ( Euromonitor, 2017 ). Revenue from tourism has increased by 4.6 percent in 2017, and this trend is expected to continue ( Euromonitor, 2017 ). The success of tourism in Spain is attributed to the fact that, as a destination, it provides both cultural resources (ranked 2nd worldwide) and natural resources (ranked 9th), according to the World Economic Forum (2017) . Other important factors for Spain are the fact that it combines successful tourism service infrastructure with air transportation and policy support ( World Economic Forum, 2017 ). The cultural and natural attractions are recognized as the two top considerations and motivations for tourism. The fastest growing segments of the tourism industry today are the cultural – and historical – sites ( Timothy and Nyaupane, 2009 ) along with natural tourism ( Kuenzi and McNeely, 2008 ).
In its 2017 annual Travel and Tourism Competitiveness Report, the World Economic Forum ranked Spain as first among the top ten countries on the Tourism Competitiveness Index. The rankings were as follows: (1) Spain, (2) France, (3) Germany, (4) Japan, (5) UK, (6) USA, (7) Australia, (8) Italy, (9) Canada, and (10) Switzerland ( World Economic Forum, 2017 ).
Spain is geographically very diverse. It shares borders with Portugal in the West and France in the Northeast. Spain is surrounded by many bodies of water – Mediterranean Sea in the East, Atlantic Sea, Gulf of Gibraltar and Gulf of Cadiz in the South, Atlantic Ocean in the West, and Bay of Biscay in the North. This waterfront location of Spain creates ample opportunities for water sports and adventure for tourists. Two very popular tourist destinations, namely, Balearic Islands and Canary Islands, are a part of Spain and a big draw for tourists. Inland, Spain has several mountain ranges, such as the Cantabrian Mountains, Iberian Mountains, Sierra Morena Mountains, etc. The country of Spain is thus gifted with abundant natural attractions.
Spain has a very rich history as well. Dating back to the Iberians and Phoenicians, cave paintings from that era still exist. Many historical attractions go back to the times of Romans. Roman rule was followed by the rule of Germanic tribes. A significant event in Spanish history is the Moorish invasion in 711 AD, with the Moorish rule lasting for nearly seven centuries, particularly in cities such as Seville and Granada. In later years, many of the Islamic monuments and buildings were taken over by Christian rulers, who built churches and cathedrals within the walls of the mosques. A classic example of the building of Islamic and Christian architecture is the Palace of Alhambra, which is probably the top cultural/historical attraction in Spain.
The purpose of the study is to identify traits of the most attractive tourism destinations in Spain using a two-step cluster analysis to ascertain the relative importance of natural, cultural, and dual attractions to target consumers. Once identified, promoting attractions that are not sufficiently leveraged will offer important opportunities to the tourism industry in Spain.
This paper is organized in seven sections. In Section 2 , we provide an overview of the geographical diversity of Spain. In Section 3 , we discuss the history of Spain highlighting the major events and places that make Spain a historically rich land. In Section 4 , we describe the lengthy process of selection and identification of the major natural, cultural, and dual (both natural and cultural) tourist attractions in each of the 17 regions of Spain. In Section 5 , we add data on tourism (number of tourist-nights) for each of the 17 regions of Spain. We use the data on the number of tourist attractions and number of tourist-nights to conduct two different types of data analyses. First, we divide the 17 regions into four categories using “high vs low” number of total attractions and “high vs low” number of tourist-nights. Next, we use a two-step cluster analysis to attribute relative importance of the natural, cultural, and dual attractions in affecting tourism. Section 6 discusses the findings of our data analysis and directions for future research. Finally, Section 7 discusses the global marketing implications of this research.
A map of Spain is presented in Figure 1 , and the 17 regions are marked 1-17.
2. Geographical diversity
Figure 2 presents a map of Spain with major natural attractions and topographical features outlined.
The Iberian Peninsula, comprising Spain and Portugal, is located in the Southwestern tip of Europe. Including the Canary Islands, in the Atlantic, West of Morocco, and the Balearic Islands, in the Western Mediterranean, Spain has a total area of 504,782 square kilometers (194,896 square miles). Relatively speaking, this is about two times the size of Oregon in the USA. The country is 1,085 kilometers from east to west, along with 950 kilometers from north to south ( Kurian, 2017 ). Spain accounts for 85 percent of the Iberian Peninsula, occupying more area in the peninsula than Portugal. The Pyrenees Mountains act as a geographic border to separate it from the rest of Europe in the north. These mountains were formed when the Iberian microcontinent collided with continental Europe millions of years ago. The mountains create the Franco-Spanish border for 435 kilometers, stretching from the Bay of Biscay all the way to the Mediterranean Sea.
The waters surrounding the country create a natural boundary accounting for 88 percent of Spain’s border. The northwestern coast has excellent harbors, especially along the Galician coast ( Spain: At-A-Glance, 2017 ). In the Northeast, Spain shares a border with France and Andorra. A diverse topography creates varied climates throughout the Peninsula, as addressed later in the paper. The Balearic Islands in the East, including Majorca and Ibiza, plunge into the Mediterranean Sea ( Payne, 1973 ). The Mediterranean coast stretches for 1660 km on the East ( Spain: At-A-Glance, 2017 ). To the South are the Canary Islands in the Atlantic off the Coast of Africa, along with Ceuta and Melilla in the North of Africa. The Canary Islands – an archipelago of 13 islands in the Atlantic – are big attractions due to their volcanic black sand beaches. The largest island, Tenerife, comprises Mount Teide, the third tallest volcano in the world ( Kurian, 2017 ). The Atlantic and the Mediterranean comprise the southern border, with the Atlantic Coast stretching for over 710 km. The coastal plains are narrow, broken up by mountains in the sea forming rocky points. These southern regions tend to be desert-like. Due to the vast variety in landscapes and diversity in geography, Spain has everything to offer its tourists ( Payne, 1973 ).
Spain is topographically divided into five different parts – aside from the 17 regions defined based on other considerations. First is Meseta, the central plateau, physically enclosed in all cardinal directions by mountains. This is the most important physical feature in Spain’s diverse topography, sloping downward from the north to the south, and from east to west. It is almost treeless, with elevations of 610 meters above sea level. The flat land extends from the Cordillera Cantábrica in the North, to the Sierra Morena in the South. From the east, it reaches from the Iberian Mountain Range to the Portuguese border in the West. Next, the northern mountains stretch from the Atlantic to the Mediterranean. The Guadalquivir Basin, in the Southwest, is the third region. The Ebro Basin, the fourth region covering one sixth of the country, is situated in the Northeast, in Aragón. Its Río Ebro is Spain’s longest river, and flows into the Mediterranean. Finally, the Mediterranean Coastal Plains constitute the fifth topographical region ( Kurian, 2017 ).
There are also the Places of Sovereignty, a three-island group near Africa, the Penon de Velez de Gomera, Penon de the Alhucemas, and Chafarinas Islands ( Spain: At-A-Glance, 2017 ). There are about 1,800 rivers and streams cutting through Spain creating even more topographical diversity in the various regions; they flow from west to south into the Atlantic, winding through mountain valleys, along rocky courses – many are dry most of the year ( Kurian, 2017 ). The Douro, Miño, Tagus, and Guadiana rivers begin in Spain and flow through Portugal, flowing into the Atlantic. The Guadalquivir River is Spain’s deepest river and the only one navigable, an excellent tourist destination for sightseeing and cruising. As they are not used for travel, transport, or irrigation, the rivers serve as a source of power for the local communities ( Spain: At-A-Glance, 2017 ). The lower Guadalquivir valley is marshy and salty. The flat fertile plain of the river is unique among Andalusia’s otherwise mountainous regions ( Kurian, 2017 ).
The highest mountain in Spain – and the peninsula – is Mulhacén, in the Baetic Range, in Sierra Nevada, at 3,482 meters. On a clear day, from its peak, one can see views of the Moroccan Rif Mountains, and half of Andalusia. This mountain attracts tourists, both experienced and inexperienced, with ice climbing, hiking, mountaineering, skiing, and snowboarding, with a geodesic vertex that draws experienced climbers from all over the world ( Mulhacén, 2017 ). Some of the country’s best agricultural areas are found around Seville ( Kurian, 2017 ).
Spain’s diverse topography and varied physical land features create different regional climates. Most of Spain has extreme temperatures and inadequate rainfall, as most of the country is on a high plateau with full seasons, but hot summers and cold winters. A colder climate characterizes the northern plateau and the Pyrenees Mountains bordering the north ( National Geographic, 2017 ). The central plateau has arid, hot summers that dry up local streams and lead to droughts and lack of water – on average, Spain receives less than 610 mm (24 inches) of precipitation per year. The Biscayan and Atlantic coasts and the northern mountains are cooler and wetter than other areas. Madrid has cold winters that may freeze local streams, but the summers are hot, with temperatures at times above 40 degrees Celsius (104 Fahrenheit); however, winter temperatures can drop down to 4 degrees Celsius (40 Fahrenheit) ( Spain: At-A-Glance, 2017 ). The southern Mediterranean coast has a subtropical climate – Malaga’s winter temperatures average 14 degrees Celsius (57 Fahrenheit) ( Spain: At-A-Glance, 2017 ).
3. Historical richness
Figure 2 also shows five key cultural hubs identified with “ * ” in the regions of Andalusia (two cultural hubs, namely, * Seville and * Granada), Catalonia ( * Barcelona), Madrid ( * Madrid), and Valencia ( * Valencia).
A key attraction for world travelers to Spain is its historical richness, its major landmarks and tourist attractions that relate this history. Spain is a country with diverse culture that date back to the Iberians, the country’s earliest inhabitants. These warlike tribes, the largest single ethnic group, traveled to the Iberian Peninsula during the second millennium BC ( Payne, 1973 ). The Eastern Iberians were influenced by Greek and Phoenicians, and their alphabet was found in pre-Roman Hispania ( Payne, 1973 ). In Cantabria, cave paintings still remain from the earliest inhabitants at Altamira, depicting prehistoric life ( History of Spain, 2016 ). Multitudes of monuments, architecture, statues, art, and artifacts have been kept intact over the centuries and are key points of interest for those traveling to Spain. To fully understand its historical significance, we herein outline the history of Spain, beginning with the Roman period.
Evidence of prehistoric life abound in Spain – in the Sierra de Atapuerca, 780,000-year-old bone fragments were found. Phoenicians, Greeks, Iberians, Celts, and Carthaginians resided in Spain at some point. However, the true birth of the historical culture is commences with the strong Roman presence in Spain. Romans arrived to the Iberian Peninsula before 200 BC, and occupied the peninsula for upwards of 600 years. They brought with them knowledge to create a road system, aqueducts, theaters, baths, and language ( Payne, 1973 ). The historic influence of Roman Catholicism is present is in the “fervent mystical element” within historical Spanish art and literature. It is also evident in the long list of saints and the many religious congregations and orders throughout history ( Spain: At-A-Glance, 2017 ). Many of these Roman-influenced historic sites remain today and are a huge draw for tourists traveling to the area.
As Germanic tribes came through the area, Roman rule dwindled. Visigoth allies of the Romans helped restore order and established a capital. They did not leave much behind for tourists, other than the oldest church (661 AD), Baños de Cerrato, in Palencia ( History of Spain, 2016 ). The Visigoths, numbering 300,000 out of a peninsula with 4,000,000 inhabitants, had powerful armed forces, but were weak economically, socially, and culturally than the Hispania majority ( Payne, 1973 ). Barcelona was occupied by the Visigoths, who changed its name to Barcinona ( History of Barcelona, 2017 ).
The Moors invaded Spain in 711 AD, from North Africa, with a lasting influence of more than 700 years. Most of the Moorish power was held in southern cities, such as Cordoba, Seville, and Granada, whose architecture reflects Moorish influence. The Mezquita of Cordoba, the world’s third largest mosque, was created by Abd ar-Rahhman and is an excellent example of Islamic art in Spain. Ferdinand III took over Cordoba, and a Christian church built within the walls of the mosque now serves as a Christian cathedral ( History of Spain, 2016 ). In the Picos de Europa Mountains of Northern Spain lies the tomb of Pelayo, one of the greatest heroes of the Christian Re-conquest. This is also a major historical tourist landmark.
The Spanish nation emerged from the marriage of Fernando and Isabella, which united the Aragón and Castile territories. After persecuting Muslims, they funded the voyage of Christopher Columbus. This led to the emergence of the Spanish Empire, after Columbus discovered the Americas, in 1492 AD. A major cultural attraction marking this period is the Granada’s Alhambra Palace (originally built in 889), where Queen Isabella is buried. After the reign of Felipe II, the Spanish Empire peaked as he made Madrid the new capital of the country. An attraction related to this ruler is El Escorial, Felipe II’s palace-monastery, near Madrid. Prior to the Spanish Inquisition, when Jews were expelled or forced to convert, the Jewish community in Spain was one of Europe’s most lively – with the Sinagoga Del Tránsito in Toledo as an important historical attraction.
The Spanish Civil War, led by General Franco’s Nationalist forces against the Republicans, inspired many art works on display in many museums, and Picasso’s “Guernica,” famous for portraying the terrors of the Spanish Civil War. The victory of the Nationalist forces of Franco in the Civil War place him at the helm of a fascist dictatorship until 1975 ( History of Spain, 2016 ). His dictatorship impeded Catalonian independence, creating a difficult period for Barcelona; but, once Franco died, Barcelona became one of the most important areas of Spain ( History of Barcelona, 2017 ). He was buried in Valle de los Caídos, near Madrid, an important tourist attraction, but a controversial one, as it fails to mention that it was built by more than 12,000 political prisoners, and that 40,000 bodies of Nationalists and Republicans are buried beneath its floor ( History of Spain, 2016 ). The government transformed the monument into one for all Spaniards that remembers the horrors of war, and its victims ( Rainsford, 2011 ).
After Franco’s death, in 1975, Juan Carlos I was crowned King, moving the country to a constitutional monarchy ( National Geographic, 2017 ). The Constitution, approved by the legislature and passed by referendum, became effective in 1978. It removed Catholicism as the official state religion even though 94 percent of the country practices Roman Catholicism ( Spain: At-A-Glance, 2017 ), and legalized divorce and abortion, previously illegal; in 2005, same sex marriage became legal ( Spain: At-A-Glance, 2017 ). Carlos I led Spain to become a stable democratic nation. Its center-left government led Spain to join the European Union in 1986, resulting in an economic boom. However, throughout the 1990s, pro-business policies created a strong divide between the rich and the poor, and high unemployment ( National Geographic, 2017 ). Barcelona was the site of the 1992 Olympic Games, which brought publicity and tourism to the city. Barcelona is one of the key cultural hubs of Spain and its architecture is peppered with Gaudí artwork ( History of Barcelona, 2017 ).
The current capital and largest city in Spain is Madrid. The second largest city, Barcelona, is its key port and important commercial center. Valencia is its manufacturing and railroad hub, with significant importance to the economy. Seville is not only the capital of the Andalusia region, but also a strong cultural center for tourists. In addition, along with being the capital of Aragón, Saragossa is also a key industrial center of Spain. In Basque country, Bilbao is a busy international port ( Spain: At-A-Glance, 2017 ) and cultural center.
Modern Spain has many cultural hubs that draw people all over the world. The four major cities most popular with tourists are Barcelona, Madrid, Seville/Granada, and Valencia, offering unique draws that attract not only tourism, but also immigration. Barcelona is known for its cosmopolitan vibe, with medieval quarters and Roman artifacts, evidencing its rich historical ties. It also features stunning artwork and architecture created by Antoni Gaudí and Lluís Doménech. This historic and artistic background makes Barcelona a unique city to visit, especially for those interested in art history. Barcelona is also one of the world’s largest business centers due to the ease of transportation, its Mediterranean climate, and variety of attractions. This hub not only features a city, but also urban beaches for tourists to relax and enjoy themselves.
Another major city of interest is Madrid, the capital, which combines a rich history with its current status as the economic, financial, and service center in Spain. The Plaza Mayor features an area called the “aristocratic center”, with the Royal Palace that dates back to the seventeenth century. There are over 60 museums drawing in tourists, and a rich nightlife culture. It is also home to the San Isidro bullfighting festival, noted as the most important in the world. Seville and Grenada are known as important cities in Spanish tradition. Seville historically was a major port for distribution of goods, as it is located on the Guadalquivir River. The Moorish culture is prominent there, making it a unique destination. Granada, at the tip of the Sierra Nevada Mountains, between the Darro and Genil rivers, features Renaissance architectural sites along with beautiful gardens. The Alhambra and Generalife are two major points of interest for travelers in this area. Finally, Valencia, Spain’s Mediterranean Port, and an important cultural hub dating back to 138 BC, harmoniously mixes innovative and experimental buildings from the new millennium with its rich historical architecture. The sea along the coast draws people in looking to relax and enjoy its natural beauty ( Tourism in Spain, 2017 ).
Celebrations abound in Spain, and are important cultural attractions in numerous cities and regions. Fiestas, for example, are important ancient traditions that begin with a mass, followed by a procession with images carried on the shoulders of the participants. They involve music, dancing, singing, and poetry readings. Two of the important fiestas that draw many tourists are the fiesta at Valencia, and San Fermin, in Pamplona. There are also solemn fiestas including the Feast of Corpus Christi in Toledo and Granada, along with Holy Week in Valladolid, Zamora, and Cuenca. A famous bullfight is the Fiesta Brava, another staple fiesta that draws people from all over the world ( Spain: At-A-Glance, 2017 ).
4. Tourist attractions in Spain: identification and selection
Spain is gifted with abundant natural, cultural, and dual (both natural and cultural) attractions. The source used for selection of the attractions for the analysis in this paper was Tourism in Spain (2017) . The source was selected after considering numerous other sources, including commercial tourism websites that we eliminated because they advocated for certain tourism destinations, subscription international tourism guidebooks – e.g., Fodor’s, Lonely Planet – and travel websites – e.g., TripAdvisor, Expedia, and Orbitz – which focused primarily on the most popular tourist attractions.
The analysis revealed that the Tourism Office of Spain (Spain.info), of the Spanish government, provided the most comprehensive and vetted impartial list of attractions, and facilitated their organization based on the criteria designated – natural, cultural, and dual (natural and cultural) tourist attractions.
5. Attraction-tourism data analysis
In this section, we add data on the number of nights spent by tourists in each of the 17 regions of Spain ( Eurostat, 2017 ).
Table I shows a region-wise number of attractions (natural, cultural, and dual attractions) and the number of tourist-nights for each of the 17 regions. These data were used to perform two different types of analyses. First, we classified 17 regions into four categories. These categories were developed on the basis of “High-Low” (above average-below average) number of total tourist attractions by “High-Low” (above average-below average) number of tourist-nights. Next, we used the two-step cluster analysis procedure in SPSS with type of tourist attractions, namely, natural, cultural, and dual as well as a categorical variable based on “High-Low” (above average-below average) number of tourist-nights. In the two-step cluster analysis procedure, the number of clusters was selected using the Akaike’s information criterion (AIC). This approach suggests that, for a given statistical model, if k is the number of estimated parameters in the model, and L is the maximum value of the likelihood function for the model, then the AIC value of the model is the following ( Akaike, 1974 ; Burnham and Anderson, 2002 ): AIC = 2 k – 2 ln ( L )
Given a set of candidate models for the data, the preferred model is the one with the minimum AIC value. Thus, AIC rewards goodness of fit (as assessed by the likelihood function), but it also includes a penalty that is an increasing function of the number of estimated parameters. The penalty discourages overfitting, because increasing the number of parameters in the model almost always improves the goodness of the fit. For our analysis, we proceeded as follows: Number of total attractions – Number of tourist ‐ nights ‐ based categorization
The average number of total tourist attractions in a region was computed at 11.47. Therefore, regions with 11 or less attractions are classified as “Low Attractions” regions while the regions with 12 or more attractions were classified as “High Attraction” regions. Next, we computed average number of tourist-nights across 17 regions. The average was 17.26 million tourist-nights. Thus, the regions with more than 17.26 million tourist-nights were classified as “High Tourism” regions, while the regions with less than 17.26 million tourist-nights were classified as “Low Tourism” regions. This two-way (high-low) classification of regions based on number of total attractions and number of tourist-nights resulted in four categories. Table II shows the regions falling under each of the four categories.
5.1 Two-step cluster analysis
Next, a two-step cluster analysis procedure was performed and the number of clusters was selected using AIC. The variables used in this procedure were number of natural, cultural, and dual attractions, and a categorical variable “High-Low” (above average-below average’ number of tourist-nights). This procedure computed AIC for possibility of a single cluster to 17 clusters, and resulted in a final two cluster solution corresponding the lowest value of AIC=62.592. The final two clusters solution corresponded to a “fair” cluster quality on the “Silhouette measure of cohesion and separation” =0.4. The membership of the two clusters is given in Table III . Also reported in Table III are the profiles of the two cluster-centroids (means and standard deviations) on the three variables, namely, number of natural, cultural, and dual attractions.
6. Discussion of results and directions for future research
An examination of Table III identifying regions with high tourism indicates that all five regions with high tourism, namely, Andalusia, Balearic Islands, Canary Islands, Catalonia, and Valencia are located either on or in a sea that surrounds Spain (see Figure 1 , map of Spain and surroundings). This suggests that Spain attracts many tourists with its beaches and opportunities for water sports. Spain has opportunities in its mountainous regions as well (see Figure 2 , map of natural attractions in Spain), but, clearly, water attractions are the biggest draw.
Similarly, an analysis of the results of the two-step cluster analysis procedure summarized in Table III indicates that the same five regions, namely, Andalusia, Balearic Islands, Canary Islands, Catalonia, and Valencia are grouped together in Cluster 1 (with “High” above average tourist-nights). Additionally, two other regions Aragón (located not too far from the Mediterranean ocean) and Asturias (located on the Bay of Biscay) are also placed in Cluster 1. Thus, the two-step cluster analysis procedure supports the finding that water-related sports and activities constitute a big draw for tourism in Spain.
In order to obtain further insights into the relative importance of the three types of attractions (natural, cultural, and dual attractions) on tourism, we examined the input (predictor) importance weights computed by the two-step cluster analysis procedure for the three types of tourist attractions for making assignment of regions to the two clusters. The means, standard deviations, and t -stats (testing the differences between the means of centroids for the two clusters) of three types of attractions are reported in Table III . As can be seen from Table IV , natural attractions are the most important, dual attractions are next in importance, and cultural attractions are the least important. This finding is consistent with our earlier interpretation that regions located on or in major bodies of water attract a larger number of tourists compared to the land-locked regions.
Having said that we must acknowledge the cultural tourism potential of Spain, which attracts tourists all over the country. Cultural gems and historical hubs like Barcelona, Granada, Madrid, Seville, and Valencia, as identified in the “History” section of this paper, offer numerous monuments, museums, and historical sites to visitors. Thus, tourism can be broadly classified into two categories of “activity tourism” and “visitation tourism” ( Manrai et al. , 2017 ). The current discussion mainly draws upon activity tourism in the above-mentioned areas. It would be important to identify why regions such as Aragón, Asturias, Castella La Mancha, Castilla y León and Galicia have less tourist traffic as evidenced by the lower number of tourist-nights, even though they have a high number of attractions.
A limitation of this study is that it did not address the current marketing efforts of national and regional tourism boards to increase tourism traffic, especially in the above-mentioned areas. Future research might investigate existing marketing efforts that national and regional tourism boards are currently undertaking to increase tourist-nights/visitors in these areas and offer suggestions for appropriate targeting world visitors to the Aragón, Asturias, Castella La Mancha, Castilla y León and Galicia regions. It is well possible that regional efforts are not adequately funded, and that national tourism funds might be successfully redirected to promote tourism in these regions and increase traffic to their respective attractions, many of them UNESCO World Heritage destinations.
In future research, there is much scope for further differentiating tourists on the basis of their motivation for tourism (natural vs historical/cultural), and for tracking the different types of tourists who are attracted to different destinations in Spain.
7. Implications for global marketing
Currently, Spain ranks number one in Travel and Tourism Competitiveness Index (TTCI) in the 2017 annual Travel and Tourism Competitiveness Report of World Economic Forum. The TTCI index is based on four category of variables, namely: enabling environment (business environment, safety and security, health and hygiene, human resources and labor market, and international communication technology, ICT, readiness), travel and tourism enabling conditions (prioritization of travel and tourism, international openness, price competitiveness, environmental sustainability), infrastructure (air transportation infrastructure, ground and port infrastructure, tourist services infrastructure), and natural and cultural resources (natural resources, cultural resources, business travel).
Spain had received several other top performance rankings in the world. For example, Spain was ranked No. 2 in the world on Tourist Service Infrastructure and Cultural resources and Business Travel; No. 5 in the World on Prioritization of Travel and Tourism; and No. 9 in the World on Natural Resources and Air Transport Infrastructure. However, it had also received several lower performance rankings. For example, it was ranked No. 98 in the world on Price Competitiveness; No. 75 in the world on Business Environment; No. 43 in the world on International Openness; and No. 31 in the world on Environment Sustainability. In order to maintain its leadership position in the Global Tourism business, Spain must keep reinforcing its strengths and address the issues that will consistently propel it to tops of international rankings.
The current study analyzed tourism by regions and by three types of tourist attractions (natural, cultural, and dual attractions). Our findings suggest that five regions in particular, namely, Andalusia, Balearic Islands, Canary Islands, Catalonia, and Valencia, attract significantly higher number of tourists than the other 12 regions. Furthermore, natural attractions were found to be most important determinants of tourism with the dual attractions being next most important, and cultural attractions being the least important tourism determinants. This is problematic, considering that Spain has gems like the Alhambra, which tell the stories of struggles between multiple civilizations, and the City of Toledo, which transports the visitors to medieval times in a time capsule.
The natural attractions of Spain were discussed earlier mainly from the point of beaches and bodies of water that offer access to water sports. Spain has several mountain ranges offering opportunities year round for mountain tourism. In the north are the Cantabrian Mountains, spanning across the region of Castilla y León and the Galicia region, boarding Portugal, has Leon Mountains. In the center of the country, in the southern part of Castilla y León region, is the Central Mountain chain, and Aragón region houses the Iberian Mountain chain. The southern part of Spain has Sierra Morena mountain range in the regions of Castilla La Mancha and Extremadura. Thus, many of the regions in Spain, which are not located “in” or “on” water, are remarkable for other natural elements that are attractive to tourists – for example, mountains. There is a need to promote tourism in these regions. Overall, thus, there are ample opportunities for global tourism in Spain.
Map of Spain and surrounding countries
Natural attractions and cultural hubs* in Spain
Number of attractions (natural, cultural, dual, and total attractions) and number of tourist-nights
Results based on the two-step cluster analysis procedure
Relative importance of input (predictor)
Akaike , H. ( 1974 ), “ A new look at the statistical model identification ”, IEEE Transactions on Automatic Control , Vol. 19 No. 6 , pp. 716 - 723 .
Burnham , K.P. and Anderson , D.R. ( 2002 ), Model Selection and Multimodel Inference: A Practical Information-Theoretic Approach , 2nd ed. , Springer-Verlag , Berlin .
Euromonitor ( 2017 ), “ Spain: country profile ”, Euromonitor Passport database, November 22, 2018 .
Eurostat ( 2017 ), “ Nights spent at tourist accommodation establishments by degree of urbanization and by NUTS 2 regions (from 2012 onwards) ”, February, available at: http://ec.europa.eu/eurostat/web/products-datasets/-/tour_occ_nin2d (accessed July 31, 2017 ).
History of Barcelona ( 2017 ), “ Tour Spain travel guides ”, available at: www.tourspain.org/barcelona/history.asp (accessed July 22, 2017 ).
History of Spain ( 2016 ), “ Key periods in the history of Spain ”, available at: www.spanish-fiestas.com/history/ (accessed December 23, 2016 ).
Kuenzi , C. and McNeely , J. ( 2008 ), “ Nature-based tourism ”, in Renn , O. and Walker , K. (Eds), Global Risk Governance: Concepts and Practice Using the IRGC Framework , Chapter 8 , Springer , New York, NY , pp. 155 - 178 .
Kurian , G.T. ( 2017 ), “ Spain: geographical features ”, available at: www.fofweb.com/activelink2.asp?ItemID=WE39&Geography.aspx&iPin= M0019860&SingleRecord=True (accessed July 31, 2017 ).
Manrai , L.A. , Manrai , A.K. and DeLuca , J. ( 2017 ), “ Twenty shades of Italy: an analysis of its cultural, natural, and dual tourist attractions with implications for global tourism marketing ”, Journal of Global Marketing , Vol. 30 No. 5 , pp. 297 - 308 .
Mulhacén ( 2017 ), “ Overview ”, available at: www.summitpost.org/mulhac-n/617430 (accessed July 11, 2017 ).
National Geographic ( 2017 ), “ Spain travel guide ”, available at: http://travel.nationalgeographic.com/travel/countries/spain-facts/ (accessed July 22, 2017 ).
Payne , S.G. ( 1973 ), A History of Spain and Portugal, Vol. 2 , University of Wisconsin Press , Madison, WI .
Rainsford , S. ( 2011 ), “ Fate of Franco’s valley of fallen reopens Spain wounds ”, available at: www.bbc.com/news/world-europe-14189534 (accessed July 31, 2017 ).
Spain ( 2016 ), Funk & Wagnall’s New World Encyclopedia , World Book, Inc. , p. 1 .
Spain: At-A-Glance ( 2017 ), Facts on File, Inc., available at: www.fofweb.com/activelink2.asp?ItemID=WE39&Country.aspx&iPin= M0019860&SingleRecord=True (accessed December 27, 2017 ).
Timothy , D.J. and Nyaupane , G.P. ( 2009 ), Cultural Heritage and Tourism in the Developing World: A Regional Perspective , Routledge , New York, NY .
Tourism in Spain ( 2017 ), available at: www.spain.info/en_US
World Economic Forum ( 2017 ), “ The travel and tourism competitiveness report ”, World Economic Forum, Geneva, available at: www.weforum.org/agenda/2017/04/which-are-the-most-tourist-friendly-countries (accessed July 31, 2017 ).
World Travel and Tourism ( 2017 ), “ Travel and tourism economic impact ”, available at: www.wttc.org/- /media/files/reports/economic-impact-research/regions-2017/world2017.pdf (accessed July 31, 2017 ).
Further reading
Spain Travel Guide ( 2017 ), “ Tour Spain travel guides ”, available at: www.tourspain.org (accessed July 22, 2017 ).
World Tourism Organization ( 2017 ), “ UNWTO tourism highlights ”, United Nations World Tourism Organization, Madrid, available at: www.e-unwto.org/doi/pdf/10.18111/9789284419029 (accessed December 8, 2017 ).
Corresponding author
Related articles, we’re listening — tell us what you think, something didn’t work….
Report bugs here
All feedback is valuable
Please share your general feedback
Join us on our journey
Platform update page.
Visit emeraldpublishing.com/platformupdate to discover the latest news and updates
Questions & More Information
Answers to the most commonly asked questions here
Evaluating the efficiency and determinants of mass tourism in Spain: a tourist area perspective
- Original Article
- Open access
- Published: 12 December 2022
- Volume 23 , pages 111–145, ( 2024 )
Cite this article
You have full access to this open access article
- Francisca J. Sánchez-Sánchez ORCID: orcid.org/0000-0001-5325-3667 1 &
- Ana M. Sánchez-Sánchez ORCID: orcid.org/0000-0002-6591-954X 1
2838 Accesses
1 Altmetric
Explore all metrics
Tourism is one of the fastest-growing economic sectors. This has piqued increasing interest in the evaluation of the performance of the sector. This paper joins this line of research by providing a potential framework for measuring efficiency in the context of a country such as Spain, where sun-and-sand tourism, usually associated with mass tourism, predominates. Tourist areas located on the coast provide the units of reference. Data Envelopment Analysis (DEA) is applied to determine the efficiency score and a Tobit-type model is employed to analyse the factors that determine efficiency. The results show that the impact of mass tourism on labour efficiency is geographically unequal, with the most efficient of the tourist areas located on the peninsular archipelagos. The analysis of the contribution of each input to the efficiency score reveals the pre-eminent role of tourism infrastructure as a lure for sun-and-sand tourism.
Estimating the hospitality efficiency in Mexico using Data Envelopment Analysis
Martin Flegl, Hazael Cerón-Monroy, … Josef Jablonský

Social Sustainability on Competitiveness in the Tourism Industry: Toward New Approach?

Key Geographical Factors for Inbound and Domestic Tourism in Hokkaido
Avoid common mistakes on your manuscript.
1 Introduction
Tourism is one of the fastest-growing economic sectors worldwide, and is fundamental for job creation and economic diversification (Sanchez and Sanchez 2018 ; Long 2011 ; Andereck and Nyaupane 2011 ). According to the World Tourism Organisation (UNWTO 2017 ), international tourism accounts for 7% of global exports of goods and services; its contribution to GDP globally is 10.4%, and it generates 1 in 10 jobs. Coastal destinations constitute the most appreciated environment, where sun-and-sand tourism has become a mass phenomenon where every year millions of people seek rest and recreation, preferably at the beach (Jedrzejczak 2004 ; Ley-Vega et al. 2007 ). The term mass tourism (Deprest 1997 ; Boyer 1999 ) was initially coined to describe a homogeneous, standardised, and rigid form of tourism, comparable to the mass production system introduced by Henry Ford (Poon 1993 ). Mass tourism is growing steadily thanks to the increased availability of free time and short-term package holidays. This type of tourism is large-scale, agglomerated, and highly seasonal. It is based on overnight stays in large hotel complexes, where tourists have consumerist habits, prefer sun-and-sand tourism, and visit large tourist destinations such as colonial cities or cities with cultural attractions located in large urban areas. Research on mass tourism that focuses on destinations in Mediterranean Europe shows that the factors most valued by sun-and-sand tourists are climate, beach quality, scenery, quality of facilities, recreational activities, safety, absence of litter, and attractiveness of the location (Jedrzejczak 2004 ; Williams 2011 ). However, other elements, such as culture and heritage, are becoming increasingly valued (Santana-Jiménez and Hernández 2011 ; Farmaki 2012 ).
The choice of Spain for the study allows us to contribute towards the literature with research regarding a leading country in the tourism sector, where the main engine of the country's economic growth is largely based on this activity (Balaguer and Cantavella-Jorda 2002 ). Competitiveness between tourism destinations is on the increase, and therefore institutions and managers have become aware of the need to improve their performance in order to remain competitive; to present a competitive advantage, hence efforts are therefore focused on the analysis of efficiency, which is key to management control and crucial in attaining better results. Efficiency analysis strives towards improvements in profitability and the optimal use of resources (Tavares 2002 ; Seiford 1997 ). The definition of efficiency states: "the ability to avoid waste, either by producing as much output as technology and input usage allow or by using as little input as required by technology and production function" (Fried et al. 2008 , p. 5). This definition associates efficiency with the maximum output that can be achieved using given resources (inputs). This paper analyses labour efficiency in the tourism sector, understood as the minimum use of tourism resources (inputs) to achieve a given output or employment (output).
Assaf et al. ( 2017 ) call for an increase in the need to increase scientific production on efficiency that considers specific destinations. This research strives to extend previous studies by means of analysing territorial areas with accumulations of tourism of a specific type of activity. The Spanish National Statistics Institute (INE) defines a tourist area as "an area made up of a group of municipalities in which tourism is specifically located". One of the objectives of this research is to evaluate the efficiency of mass tourism in tourist areas along the Spanish coast, where sun-and-sand tourism is concentrated. Despite the importance and interest that the analysis of efficiency in these areas can present, the literature on efficiency in this type of territorial unit remains scarce (De Carlos Villamarín et al. 2016 ), although certain papers can be found that analyse efficiency both in terms of country (Lozano and Gutiérrez 2011 ) and of the region (Barros et al. 2011a , b ; Huang et al. 2012 ; Brida et al. 2012 ; Benito-López et al. 2014 ; Sellers-Rubio and Casado-Díaz 2018 ).
There are various approaches to the measurement of the efficiency of the tourism sector (Wassenaar and Stafford 1991 ; Baker and Riley 1994 ; Ismail et al. 2002 ), one of which is Data Envelopment Analysis (DEA). In recent years, numerous papers have applied DEA methodology to analyse various aspects of the efficiency of tourism activity (Poldrugovac et al. 2016 ; Ohe and Peypoch 2016 ; Manasakis et al. 2013 ; Such-Devesa and Mendieta-Peñalver 2013 ; Assaf et al. 2012 ; Perrigot et al. 2009 ). Efficiency studies seldom include environmental variables, such as destination characteristics (Assaf et al. 2012 , 2017 ; Assaf and Josiassen 2012 ), and there is therefore a need for research on these types of factors. This leads to the second objective of the paper, which seeks to determine the impact of various environmental factors on labour efficiency. In this context, variables related to the market and to the tourist destination that may influence efficiency are considered. For this purpose, the Analysis of Variance and a Tobit-type model are applied (Wang et al. 2006 ; Barros et al. 2011a , b ; Huang et al. 2012 ; Parte-Esteban and Alberca-Olive 2015 ).
This paper is structured as follows. Section 2 studies the situation of the Spanish tourism sector. Section 3 presents the theoretical framework and defines the working hypotheses. Section 4 presents the analysis methodology and data sources. The results are presented in Section 5 . Finally, in Section 6 , the discussion and conclusions of the study are presented.
2 Analysis of the spanish tourism sector
The demand for leisure has expanded substantially in recent years due to the growth of the global economy. In Spain, holiday tourism has become a key activity. In 2019, the country ranked second in the world in number of tourist arrivals, only surpassed by France. Tourist demand, both national and international, is fundamental to the growth of the sector in Spain. In the last decade, international tourism in Spain has experienced a major increase, and has surpassed that of national demand (see Fig. 1 ). In 2019, 48.51% of tourists were national, while 51.49% were international, of which 48.27% were European, with 18 million English tourists, 11.15 million German tourists, and 11.14 million French tourists (INE 2019 ).

Evolution of the number of national and international tourists in Spain
This significant flow of international tourist arrivals can be explained by the political problems experienced by some of Spain's direct competitors in sun-and-sand tourism, such as Egypt, Tunisia, and Greece. Moreover, several of these countries have entered a stage of tourism stagnation, which they are striving to solve by offering an experience to sun-and-sand tourism, with leisure and recreational by-products (Bonet 2003 ; Williams and Buswell 2003 ).
The profile of the international tourist visiting Spain is that of an individual between 25 and 44 years of age, salaried, with higher education and an average professional position, who lives with a partner, travels by air for leisure and recreational reasons, and tends to stay in hotel establishments. The level of satisfaction of international tourists with their visit to Spain is high (8.5 out of 10) and their loyalty to the destination is also high, according to the Institute of Tourism Studies (IET 2013 ).
In terms of the country's preferred destinations, the highest tourist occupancy was mainly in coastal areas, which underlines the visitor's preference for sun-and-sand tourism. Specifically, the regions of Catalonia, Andalusia, Valencia, Madrid, the Balearic Islands and the Canary Islands stand out, accounting for 76.36% of arrivals (Fig. 2 ).

Tourists per destination (%)
These preferences for coastal destinations can be understood by looking at the main reasons for the trip. In 2019, leisure, recreation, and holidays, with 87.38%, constituted the main purpose of visits to Spain, while business, professional, and other reasons made up less than 13% (Fig. 3 ).

Visitor arrivals: reason for travel in 2019 (%)
This major boom in the sector has contributed significantly to the generation of employment, since the number of people employed in tourism shows a steady and growing trend (Fig. 4 ). In 2019, the number of workers in the tourism sector affiliated to Social Security amounted to 2.72 million workers, which represents approximately 12.9% of the total number of employees in the whole country (INE 2019 ). The employment potential of the sector is enormous, although certain groups, such as women, young people, and older adults, have traditionally been marginalised in the labour market (Pérez 2010 ); however, these jobs do have particular characteristics, especially regarding their seasonal nature and insufficient professionalisation (Pou 2012 ).

Evolution of employees in tourism
In 2019, tourism contributed a total of 154,487 million euros to Spain's Gross Domestic Product (GDP), which represents 12.4% of its GDP of that year. An example of this importance can be seen in Fig. 5 , which shows a comparison of the evolution of tourism GDP compared to national GDP. The tourism sector generates highly significant income for the country, with an increase in tourism expenditure of more than 21,000 million euros in the last four years. The year 2019 ended with the highest volume of tourism activity in Spain to date: more than 140,000 million euros (INE 2019 ).

Evolution of the year-on-year rate of change of tourism GDP and the year-on-year rate of change of the GDP of the Spanish economy
3 Research framework and working hypotheses
The evaluation of efficiency is fundamental for the tourism sector: it helps managers to make decisions by estimating performance, and provides companies with a competitive advantage. Therefore, institutions are also concerned with the analysis of the performance of tourism activities, given their enormous economic and social impact (Benito-López et al. 2014 ; Detotto et al. 2014 ; Solana-Ibáñez et al. 2016 ; Sellers-Rubio and Casado-Díaz 2018 ; Casado-Díaz and Sellers-Rubio 2020 ).
In studies into tourism efficiency, the sample, the methodology used, and the inputs and outputs employed are all fundamental (Assaf and Tsionas 2019 ; Assaf and Josiassen 2012 ). Regarding the sample studied, these papers propose two lines of research: the first examines samples of hotels in selected tourist destinations, while the second evaluates hotel brand efficiency. In reference to the first line of research, the literature mainly analyses destinations located in Asia (Yu et al. 2019 ; Liu et al. 2017 ; Yi and Liang 2015 ; Huang et al. 2012 ; Bi et al. 2011 ; Wang et al. 2007 ), in the United States (Gu, 2004 ; Brown and Ragsdale, 2002 ), and in Europe (Amado et al. 2017 ; Oliveira et al. 2013a ; Brida et al. 2012 ; Barros et al. 2011a ). In the case of Spain, there is the work of Deng et al. ( 2019 ), Arbeló et al. ( 2017 ), Arbeló-Perez et al. ( 2017 ), Solana-Ibáñez et al. ( 2016 ), Fernández and Becerra ( 2015 ), Parte-Esteban and Alberca-Oliver ( 2015 ), Benito-López et al. ( 2014 ), and De Jorge and Suárez ( 2014 ).
As for the methodology employed to assess efficiency, initially non-frontier-type models were applied (Wassenaar and Stafford, 1991 ; Baker and Riley, 1994 ), although nowadays, models based on the frontier concept are more widely used. The latter approach uses two different study perspectives: Data Envelopment Analysis (DEA) and the parametric stochastic frontier method. The DEA methodology (Charnes et al. 1978 ) is a non-parametric linear programming method (see, for example, the works of Yuan and Liu 2020 ; Kularatne et al. 2019 ; Soysal-Kur 2017 ; Yi and Lian 2015 ). In recent years, numerous studies have applied DEA for the study of tourism efficiency in various contexts: in hotel studies (Higuerey et al. 2020 ; Lado-Sestayo and Fernández-Castro 2019 ; Karakitsiou et al. 2018 ; Solana-Ibáñez et al. 2016 ; Ohe and Peypoc, 2016 ; Manasakis et al. 2013 ; Assaf et al. 2012 ), in travel agencies (Dragan et al. 2018 ; Ramírez-Hurtado and Contrera, 2017 ; ZhiYi 2015 ; Fuente 2011 ; Barros and Diek 2007 ), and in airlines (Shirazi and Mohammad, 2019 ; Yu et al. 2019 ; Sakthidharan and Sivarama, 2018 ; Sing 2011 ; Barbot et al. 2008 ). Parametric stochastic frontier methods (Aigner et al. 1977 ; Meeusen and van den Broec 1977 ) are based on econometric models. This methodology is used in the analysis of the efficiency of the tourism sector (Deng et al. 2019 ; Arbeló et al. 2017 ; Arbeló-Pérez et al. 2017 ; Bernini and Guizzardi 2016 , 2010 ; Guetat et al. 2015 ; Oliveira et al. 2013b ; Kim 2011 ).
The DEA methodology enjoys several advantages over stochastic frontier methods. Multiple outputs can be considered, while in the stochastic frontier methodology only one output can be used. Furthermore, DEA is a non-parametric technique, and therefore it does not need to consider a functional form in order to establish the relationship between inputs and outputs, whereas in stochastic frontier techniques this form is necessary.
The selection of inputs and outputs has generated debate in the literature (Perrigot et al. 2009 ). In practice, the choice of inputs and outputs is made according to data availability and to experience in formulating and implementing models (Hwang and Chang 2003 ). The inputs and outputs commonly used in research on tourism efficiency are classified into physical variables, of which the most common are the number of employees and the number of available job vacancies (Oukil et al. 2016 ; Assaf et al. 2015b ; Chen 2009 ; Hwang and Chang 2003 ). Financial variables, such as employee wages, operating costs, profits, revenues and sales, have also been considered (Detotto et al. 2014 ; De Jorge and Suárez 2014 ; Barros et al. 2011a ; Wang et al. 2007 ).
In Spain, studies on tourism efficiency are both scarce and relatively recent (Benito-López et al. 2014 ; De Jorge and Suárez 2014 ; Parte-Esteban and Alberca-Oliver 2015 ; Fernández and Becerra 2015 ; Solana-Ibáñez et al. 2016 ; Arbeló et al. 2017 ; Deng et al. 2019 ; Sánchez-Sánchez and Sánchez-Sánchez 2021 ). The majority of these studies carry out analysis at the regional level; however, there is a lack of research that assumes the geographical perspective of tourist areas. In this context, the study of the impact of mass tourism (predominant in Spain) on the efficiency of the labour market in terms of tourist areas can make makes a significant contribution to the existing literature. This leads us to formulate the following research hypothesis:
Hypothesis 1: Mass tourism is an activity that has a relative impact on labour efficiency in coastal tourist areas .
Once the impact of mass tourism on tourist efficiency has been studied, the work is complemented by another research objective, which analyses the influence of certain environmental factors of the tourist destination on efficiency. Lovell ( 1993 ) indicates that “the identification of the factors that explain differences in efficiency is essential for improving the results of firms although, unfortunately, economic theory does not supply a theoretical model of the determinants of efficiency”. There are numerous factors influencing efficiency that are not controlled for (Coelli et al. 1998 ). For this reason, the study of models and determinants of tourism destinations has recently become of great interest (see, for example, Mazanec et al. 2007 ; Tsai et al. 2009 ; Crouch 2011 ; Assaf and Josiassen 2012 ; Benito-López et al. 2014 ; Marco-Lajara et al. 2014 ). Existing work explains efficiency by identifying its determining factors (Assaf and Josiassen 2012 ; Assaf et al. 2012 ; De Jorge and Suárez 2014 ; Parte-Esteban and Alberca-Oliver 2015 ; Sellers-Rubio and Casado-Díaz 2018 ). These determinants consider several factors: the tourist destination (Sellers-Rubio and Casado-Díaz 2018 ; Yang and Cai 2016 ; Assaf et al. 2015a ); infrastructure, services, interest, and image projected by the destination (Assaf and Josiassen 2012 ); tourism management factors (Hwang and Chang 2016 ; De Jorge and Suárez 2014 ; Xiao et al. 2012 ); and environmental factors (Chen et al. 2018 ; Sellers-Rubio and Casado-Díaz 2018 ; Solana-Ibáñez et al. 2016 ; Assaf et al. 2012 ; Shieh 2012 ; Wang et al. 2006 ). For all these reasons, and in order to complete the efficiency study, it is interesting to analyse the variables that influence efficiency, especially concerning the impact of environmental variables. For the analysis of these environmental factors, four variables are considered: (1) Length of stay; (2) Number of international tourists; (3) Hotels with quality distinction; and (4) Location of the tourist destination. The first two variables are related to the market, while the last two variables are associated with the tourist destination.
The length of stay variable is intended to measure a crucial temporal aspect for the tourism industry, given that tourists with longer stays generate a stronger economic, social, and environmental impact than those with shorter stays (Barros and Machado 2010 ; Parte-Esteban and Alberca-Oliver 2015 ; Sellers-Rubio and Casado-Díaz 2018 ). This variable captures the tourist's perception of the tourist destination: the longer they stay at their destination, the greater its perceived attractiveness (Botti et al. 2008 ).
The number of international tourists exerts a strong impact on tourism efficiency (Hwang and Chang 2003 ; Chen 2010 ; Huang et al. 2012 ; Ben Aissa and Goaied 2016 ; Assaf et al. 2017 ; Sellers-Rubio and Casado-Díaz 2018 ), since international tourists stay longer and spend more (Rosenbaum and Spears 2006 ).
The quality control variable can present a competitive advantage for companies in the sector (Akbaba 2006 ; Chen 2013 ). In the hotel industry, quality is usually measured through the hotel category, that is, its number of stars. However, this star rating has been questioned as an indicator of quality (Núñez-Serrano et al. 2014 ; López-Fernández and Serrano-Bedia 2004 ), and it has even been shown that it is not an important indicator in the measurement of efficiency (Oliveira et al. 2013a ). Another way to measure hotel quality is through quality assurance programmes (Brown and Ragsdale 2002 ; Claver et al. 2006 ). Certain research positively relates efficiency to the number of quality certificates (Claver-Cortés et al. 2007 ; Costa 2004 ), while other studies establish a negative relationship (Sellers-Rubio and Casado-Díaz 2018 ; Fernández and Becerra 2015 ).
The location of the tourist destination can determine the occupancy rate of hotels and their profitability (Lado-Sestayo et al. 2016 ). On the other hand, the location of the destination has also been a factor commonly considered in factor analysis, whereby it is found that tourist areas located on the coast tend to show higher efficiency than other areas (Barros et al. 2011a ; Benito-López et al. 2014 ; Solana-Ibáñez et al. 2016 ; Sellers-Rubio and Casado-Díaz 2018 ), although certain studies do find a negative relationship (Parte-Esteban and Alberca-Oliver 2015 ).
The analysis of environmental factors that determine efficiency leads to the following working hypotheses:
Hypothesis 2: Tourist destinations located on peninsular archipelagos have higher labour efficiency than other tourist areas .
Hypothesis 3: The length of the tourist stay has a direct and positive relationship with the labour efficiency of tourist areas .
Hypothesis 4: The number of international tourists has a direct and positive relationship with the labour efficiency of tourist areas .
Hypothesis 5: The quality of hotels has a direct and positive relationship with the labour efficiency of tourist areas .
Table 1 provides a summary of the various papers that apply DEA to efficiency measurement and that propose a second stage of research for the analysis of the relationship between efficiency and its possible determining factors.
4 Methodology and sources
The data employed herein is taken from official statistics published by the National Statistics Institute (INE). Specifically, the data comes from the Hotel Occupancy Survey for the year 2019. This year has been selected because it is the one prior to the beginning of the COVID-19 health crisis, since the aim of the study is to evaluate the efficiency of mass tourism in tourist areas of the Spanish coast, in a context of "normality", without external disturbances. For this reason, a more recent time period is not considered, given that the special situation produced by the pandemic would not reflect the reality of the sector. The Hotel Occupancy Survey survey is carried out on a monthly basis, and its population scope includes all hotel establishments in Spain. This Survey offers information on the demand side, where data is provided on travellers, overnight stays and average stay distributed by country of residence for non-resident travellers in Spain and the category of the establishments they occupy, or by Autonomous Community of origin in the case of Spanish travellers. On the supply side, the estimated number of establishments open, estimated bedplaces, occupancy rates and information on employment in the sector, according to the category of establishment, are provided.Official statistics published by organisations such as Exceltur (Business Tourism Assessment 2019 and Outlook for 2020) and the Bank of Spain (National Accounts Statistics of the Spanish Economy) have also been used. It also uses data published by INE on the Tourism Satellite Account, which provides complete information on the economic relevance of tourism in Spain through macroeconomic indicators such as the contribution of tourism to GDP, employment, production and demand.
In order to measure mass tourism, this work studies the sun-and-sand tourism on the Spanish coast. The coastal tourist areas provide the unit of analysis of the study, and hence the choice of the study variables is conditioned by the availability of information in the databases. The INE defines a tourist area as "an area made up of a set of municipalities in which tourist inflow is specifically located". This study considers the 31 tourist areas of the Spanish coastline.
For the selection of variables, it has been taken into account that tourism fundamentally manifests itself in terms of hotel occupancy (Ivanov and Zhechev 2012 ; Assaf and Barros 2011 ; Chen 2010 , 2011 ) and as employment or job performance (Karatepe 2012 ; Li et al. 2012 ). Many of the variables employed in the study are frequently used in the literature to study tourism efficiency (see, for example, the works of Deng et al. 2019 ; Sellers-Rubio and Casado-Díaz 2018 ; Soysal-Kurt 2017 ; Hadad et al. 2012 ; Huang et al. 2012 ; Lozano and Gutiérrez 2011 ; Hwang and Chang 2003 ).
The data matrix for the efficiency analysis consists of 5 variables collected for each of the 31 coastal tourism areas. For the data envelopment analysis (DEA), one output, in the form of the number of employees, is considered (Cvetkosa and Barišić 2017 ; Sánchez-Sánchez and Sánchez-Sánchez 2021 ), together with four inputs: number of tourists (Barros et al. 2011b ; Huang et al. 2012 ; Benito-López et al. 2014 ); number of overnight stays (Johns et al. 1997 ; Solana-Ibáñez et al. 2016 ); number of hotels (Sellers-Rubio and Casado-Díaz 2018 ; Sánchez-Sánchez and Sánchez-Sánchez 2021 ); and number of room vacancies (Hwang and Chang 2003 ; Barros et al. 2011b ; Benito-López et al. 2014 ; Oukil et al. 2016 ; Sellers-Rubio and Casado-Díaz 2018 ).
Four variables will be employed to study the impact of environmental variables on tourism efficiency: length of stay (Parte-Esteban and Alberca-Oliver 2015 ; Sellers-Rubio and Casado-Díaz 2018 ); number of international tourists (Ben Aissa and Goaied 2016 ; Assaf et al. 2017 ; Sellers-Rubio and Casado-Díaz 2018 ); hotels with quality distinction (Fernández and Becerra 2015 ; Poldrugovac et al. 2016 ; Oukil et al. 2016 ; Sellers-Rubio and Casado-Díaz 2018 ; Kularatne et al. 2019 ); and tourist destination location (Solana-Ibáñez et al. 2016 ; Parte-Esteben and Alberca-Oliver 2015 ; Oliveira et al. 2013a ; Bernini and Guizzardi 2010 ). The description of the variables considered, together with several associated statistical measures, are listed in Table 2 .
Note that the variables considered in the analysis of environmental factors were not selected as inputs in the DEA model so as not to reduce the explanatory power of the DEA model.
The DEA methodology must comply with the condition that all inputs must be positively related to at least one output (Sigala et al. 2004 ; Chiang 2006 ; Perrigot et al. 2009 ). The isotonicity test enables this rule to be verified by testing the statistical significance of the correlation between the variables considered. Table 3 shows Pearson’s correlation coefficients and the p-values (p) between inputs and output. The inputs studied are statistically significant, and are positively correlated with the output, and hence the selection of variables is correct and all the variables selected comply with the rule for the application of the DEA methodology. Furthermore, it can be observed that the inputs are positively related to each other, which indicates that the coastal tourist areas with the most tourists are those with the most overnight stays, the most hotels, and the most hotel beds.
4.1 Data Envelopment Analysis (DEA)
Data Envelopment Analysis (DEA) is a non-parametric technique employed to compare the efficiency of a set of organisations (DMU) based on data containing information on certain variables. The variables are classified as inputs or outputs according to the production process, that is, inputs are the resources that influence the production of outputs.
The DEA methodology assigns an efficiency score to each DMU. If the efficiency score for a given DMU is equal to 1, then that DMU is efficient; if a DMU scores below 1, then it is inefficient.
Charnes et al. ( 1978 ) defined the standard input-oriented CCR DEA model. In this model, U = {1,2,…,u} is considered to be a set of independent DMUs, each consuming a set of different inputs, I = {1,2,…,n}, in amounts \({x}_{ij},\) to create a set of different outputs, O = {1,2,…,m}, in amounts \({y}_{kj}\) . The efficiency value of a DMU, \({j}_{0} \epsilon U\) , is calculated through the following linear programming problem:
According to the efficiency scores obtained, a ranking of inefficient DMUs can be defined. The efficient DMUs, however, have the same efficiency value, and therefore they cannot be ranked. In DEA, there are various ways to obtain an additional ranking of efficient DMUs. Two of the most commonly used methods are the Global Leader (Oral and Yolalan 1990 ) and the super-efficiency score (Andersen and Petersen 1993 ). The term Global Leader highlights the unit with the best overall performance. The efficient unit that appears most frequently in the reference sets of inefficient units is classified as the Global Leader. The super-efficient score method excludes the DMU, for which the efficiency value is calculated, from the initial set of DMUs. This method can reach values larger than 1 and can be applied to rank all DMUs. The super-efficiency method has the advantage over other methods in that it is applied to sort only the efficient DMUs, since the super-efficiency values of the inefficient DMUs are the same as their efficiency values. This is the method selected in the study to establish the ranking of efficient units.
The super-efficiency value of each DMU, \({j}_{0} \epsilon U\) , for the standard input-oriented CCR DEA model is obtained as follows:
4.2 Analysis of variance and the tobit model
In order to examine whether work efficiency is determined by various environmental variables, Analysis of Variance and a Tobit-type specification are applied.
The analysis of variance, also known as ANOVA model, basically allows comparing the mean values of the dependent variable in J populations where the factor levels are different, in order to determine if there are significant differences according to these levels or if, on the contrary, the response in each population is independent of the factor levels. The null hypothesis tested in the one-factor ANOVA is that the population means are equal. In our case, two groups of tourist areas are distinguished, those with efficiency values above the sample mean and those with scores below the mean efficiency score. This analysis will allow us to check whether the differences in the mean scores of the inputs studied in the two groups are random. The values of the test statistic will show the degree of importance of the inputs in explaining the labour efficiency of the tourist areas (the higher the test statistic, the greater the importance of the input). The analysis of variance methodology will also be applied to study the possible relationship between the input efficiency measure and the location of the tourist area. For this purpose, two groups of tourist areas will be considered, depending on whether the area is located on the mainland or in one of the archipelagos, analysing whether or not there are significant differences in the mean values obtained in the efficiency scores of these groups.
The Tobit model or limited dependent variable regression model is an alternative model to the logit and probit models. In this model, the sample is censored, i.e. the regression can be left-censored or right-censored (or even both) or truncated; so you can have a censored sample model or truncated, Footnote 1 in which the dependent variable assumes values between 0 and 1. The Tobit model is a restricted dependent variable model (Greene 2004 ), and the explained variables can only be observed under restricted conditions.The basic form of the Tobit model is shown in the following specification:
\({E}_{j}^{*}=\alpha +{Z}_{j}\delta +{\varepsilon }_{j}\) , \({\varepsilon }_{j}\sim N(0,{\sigma }_{\varepsilon }^{2})\) j = 1, …, n,
where \({E}_{j}^{*}\) is the dependent variable vector, that is, the efficiency score of the DMU (j), i.e. the labour efficiency score of tourist area j; α is the model constant, ε j is a white-noise variable, Z j is a vector of environmental variables that are expected to be related to the efficiency score, and \({E}_{j}\) is the observed value, i.e. the restricted value of the efficiency of the tourism sector in Spain. When \({E}_{j}^{*}\in \left[\mathrm{0,1}\right]\) , \({E}_{j}\) equals \({E}_{j}^{*}\) , which is the efficiency value that can be observed, but when \({E}_{j}^{*}\notin \left[\mathrm{0,1}\right]\) , can’t be observed.
In our case, the empirical Tobit model would be as follows:
\({E}_{j}={\alpha }_{0}+{\delta }_{1}{Foreigners}_{j}+{\delta }_{2}{Length\ of\ stay}_{j}+{\delta }_{3}{Quality}_{j}+ {\varepsilon }_{j}\) where E j is the labour efficiency variable for Spanish tourist areas, adopting the efficiency value measured by DEA; α 0 is the constant term; \({\delta }_{1}\) , \({\delta }_{2}\) , \({\delta }_{3}\) are the parameters to be estimated and ε j is a white-noise variable. Foreigners is the number of foreign tourists. Normally, high values of the variable coincide with tourist areas that are characterised by a good performance of tourism employment, so a negative sign is expected. In other words, high levels of foreign tourists are associated with low levels of (in)efficiency. Length of stay is the duration (in days) of the holiday stay, high values of the variable are expected to pertain to tourist areas with high tourism performance values. Therefore, the relationship between E and Length of stays is expected to be negative. Quality is the number of hotels recognised with a quality distinction. Normally, tourist areas with a high quality of tourist facilities have good employment efficiency values. Hence, a negative sign is expected.
The analysis of labour market efficiency caused by mass tourism is presented by distinguishing two cases: firstly, the efficiency ranking by tourist areas is presented; and secondly, the analysis of environmental factors is realised.
5.1 Labour efficiency per tourist area
DEA is applied to identify labour-efficient tourism zones. Table 4 presents the ranking of labour-efficient tourist areas, and shows the efficiency score of these areas in decreasing order. The results indicate that there are only 3 tourism areas that reach labour efficiency (Isla de la Gomera, Sur de Tenerife, and Costa da Morte).
Figure 6 presents the efficiency scores for each tourism zone, and the red line therein indicates the average efficiency score, the value of which stands at 0.752. Of the 31 tourism zones studied, only 14 have an above-average efficiency score. The most outstanding areas in terms of efficiency score are located on one of the two mainland archipelagos (Balearic and Canary Islands). Of the 3 efficient areas, 2 are located on islands in the Canary Islands (Isla de la Gomera and Sur de Tenerife) and, in addition, another 8 areas located on islands on the archipelagos obtain an above-average efficiency score. At the opposite extreme are the tourist areas located on the coast of Catalonia (Costa Brava, Costa Barcelona, and Costa Daurada), which obtain very low efficiency scores (Table 4 ).

Efficiency scores per tourism zone
These results enable us to state that, although the Spanish tourism market is dominated by mass tourism, the impact of this tourism on employment is unequal, in that it fails to have a significant effect on efficiency in the areas in which it takes place, and very few tourist areas make efficient use of the available resources, thereby confirming one of the research hypotheses.
As a sensitivity and robustness analysis of the DEA model, an alternative DEA model has been considered in which environmental factors have been taken as inputs. The results are shown in Table 5 . It can be seen that the results are sensitive to alternative inputs to those initially considered, given that the number of efficient tourist zones increases considerably, from 3 zones in the original DEA model to 13 efficient zones. Furthermore, when considering environmental factors as inputs in the alternative DEA model, the average efficiency score increases considerably, from 0.752 points to 0.913 points. This improvement does not necessarily imply that the alternative model is better, the large number of efficient areas obtained in the alternative DEA model does not seem to reflect the reality of the performance of the tourism areas analysed, while the original DEA model seems to reflect their performance more closely. Since as the existing literature shows, the inputs considered in the original DEA model are more appropriate to measure the objective pursued in the paper, given that this literature considers that employment in the tourism sector is based on the number of tourists, their accommodation needs, and/or the resources on which tourism is related (Deng et al. 2019 ; Sellers-Rubio and Casado-Díaz 2018 ; Soysal-Kurt 2017 ; Huang et al. 2012 ; Hadad et al. 2012 ; Lozano and Gutiérrez 2011 ).
Given the importance of achieving labour efficiency in tourist areas, the next task is to identify the contribution of the inputs to the efficiency results obtained. For this purpose, two groups of tourism zones are distinguished: on the one hand, those with efficiency values above the sample mean, and, on the other hand, those with scores below the mean efficiency score. Table 5 shows the analysis of variance, which leads us to conclude that the null hypothesis of equality of means between the two groups of tourist areas for all inputs is rejected, since the differences in the mean scores of the inputs studied in the two groups are not random. The degree of importance of the inputs in explaining the labour efficiency of the tourist areas is as follows: (1) hotels; (2) overnight stays; (3) beds; and (4) tourists (Table 6 ). This result is somewhat different from that obtained by Martin et al. ( 2018 ), where it is established that the variables that refer to the availability of accommodation and the flow of international visitors are decisive in determining the level of seasonality of the tourist destination. Thus, supply and demand variables are key to characterise the intensity of the tourist flow at certain times of the year. This difference in results is basically due to the fact that Martin et al. ( 2018 ) measure tourism seasonality based on indicators that are constructed from individual variables and analyse the amount of information provided by each variable in the construction of the synthetic indicator. Seasonality is precisely the differential element that marks the discrepancies in the results in terms of the discriminating power of the variables.
5.2 Analysis of environmental factors
The analysis of the results obtained for the efficient tourist areas suggests that there may be a relationship between labour efficiency and the location of the tourist area, given that the tourist areas with the highest efficiency are those located on the peninsular archipelagos. Therefore, the evaluation of the location of the tourist destination as a factor that has a significant influence on efficiency is considered, whereby the possible relationship between the measurement of efficiency in the input and the location of the tourist area is studied. This involves determining whether or not there are significant differences in the mean values of in the efficiency scores between the two groups in terms of whether the tourist area is located on the mainland or on an archipelago. The Analysis of Variance methodology (Statistic F = 12.869; p = 0.001) leads to the rejection, with a 1% level of significance, of the hypothesis of equality of means for the input efficiency scores in the two groups of tourist areas according to their location. When studying the mean efficiency values for each group (Table 7 ), it can be observed that the tourist areas located on certain islands of the archipelagos are more efficient on average than the tourist areas located on the mainland. These results confirm the positive effect of the location of the tourist destination on labour efficiency.
In order to continue with the study of environmental factors, it is also analysed whether variables other than those used in the DEA model influence efficiency. It must be considered that the inclusion of too many variables in the DEA model can reduce theidentification capacity of the model (Lee et al. 2012 ). For this reason, a Tobit-type regression model is used (Coelli et al. 1998 ; Perrigot and Barros 2008 ; De Jorge and Suárez 2014 ).
Three variables are considered that were not selected as inputs or outputs in order not to reduce the explanatory power of the DEA model (Lee et al. 2012 ). Two of these variables are related to the market: the length of stay (Length of stay), and the number of international tourists (Foreigners). On the other hand, a variable related to the tourist destination is considered, which measures the quality of the destination through the hotels awarded a Q (Quality) quality mention.
Recall that the specified model is as follows:
\(E_j=\alpha_0+\delta_1{Foreigners}_j+\delta_2{Length\;of\;stay}_j+\delta_3{Quality}_j+\varepsilon_j,\;j=1,\;\dots,31\)
where E is the efficiency score, α 0 , \({\delta }_{1}\) , \({\delta }_{2}\) , \({\delta }_{3}\) are the parameters to be estimated, and ε is a white-noise variable. In this model, the dependent variable (efficiency score) represents the inefficiency mode, and therefore an estimated parameter with a negative sign indicates a positive effect on efficiency, while an estimate with a positive sign indicates a negative effect on efficiency.
With regard to the significance of the variables, all the variables under study were found to be statistically significant (Table 8 ). With respect to the working hypotheses, it is confirmed that the influence of length of stay, number of international tourists, and tourism quality all exert a positive impact on labour efficiency. The fact that length of stay has a positive effect on efficiency shows that destinations and tourism establishments must work together to offer a significant variety of activities to encourage and motivate tourists to extend their length of stay. To a certain extent, this variable captures the capacity of the tourist area to attract new visitors. The number of foreign tourist arrivals has a positive effect on efficiency, which indicates that the high purchasing power and larger travel budget of this type of tourist exert a greater impact on the labour market, thereby highlighting the importance of the foreign tourism market. The positive effect of the tourist quality of hotels on efficiency shows that greater inputs are needed to offer a high-quality service. Quality is a major determinant in attracting high-income tourists, staying in higher-quality hotels, and paying higher rates, which means that the hotel may need more labour to maintain the required quality standard and, therefore, the final effect on efficiency is positive. This influences the hotel's commitment to implement a quality system, which entails major investment.
5.2.1 Robustness analysis
The presence of a potentially endogenous explanatory variable (understood as the existence of correlation between this variable and the error term) in the equation that modelling the environmental factors that determine efficiency can be interpreted as a problem of simultaneity or the existence of omitted or unobservable variables. In such a case, estimates that include the potentially endogenous variable in the equation under study as an additional exogenous variable are biased. The endogeneity test (Hausman test) is applied to perform this analysis, where the relationship between the explanatory (independent) variables and the disturbance variable is studied. Under the null hypothesis, the model is correctly specified with all explanatory variables as exogenous. Under the alternative hypothesis, the residuals from a linear regression of the potentially endogenous variable on a set of instruments are included in the regression. Rejection of the null hypothesis would imply that these residuals are significant and therefore there would be an endogeneity problem, which would imply the estimation of an alternative model to the one initially specified. The endogeneity test with the variables Foreigners, Length of stay Quality has shown that they are not endogeneous (the p-values are 0.157, 0.094 and 0.254 respectively), so the model proposed with the selected environmental factors is correct. On the other hand, the variance inflation factor is calculated by auxiliary regression to diagnose the multicollinearity of the processed independent variables. This test gives a value of VIF = 3.142, which is less than 10, so according to the empirical principle, there is no multicollinearity between the independent variables.In order to test the Tobit regression variables and ensure the robustness of the model, the Least Squares and Fully Modified Least Squares models are estimated, thereby testing the impact of external structural factors on efficiency (Faleye et al. 2014 ; Li et al. 2020 ). For the different regression models estimated (see Table 9 ), the significance test results are consistent with the Tobit regression results, showing that the specified Tobit model is robust.
Finally, the stability study of the model is carried out for the different groups of tourist areas reflected in the analysis. For this analysis, we first studied the stability of the model when considering the grouping of the tourist areas according to whether the efficiency is higher or lower than the average, in which case the Chow test, at a 5% significance level (F-statistic = 1.776, p-value = 0.183), shows that the model is stable for the sub-samples considered, with no structural change. In the case of considering the grouping corresponding to the location (archipelago or peninsula), the Chow test (F-statistic = 1.052, p-value = 0.351) also shows the stability of the model.
6 Discussion and conclusions
This paper studies mass tourism, which is usually associated with so-called sun-and-sand tourism. The study is motivated by the importance and weight of tourism in the Spanish economy, since Spain constitutes the world leader in holiday tourism destinations. This work contributes to the literature on tourism efficiency, and proposes an innovative model of geographical analysis, whose main contribution involves the territorial units studied. Its analysis is centred on coastal tourist areas: these destinations are smaller geographical spaces than those hitherto examined in the literature on efficiency. The analysis employs stochastic DEA applied to hospitality industry data set in 31 Spanish tourist areas for the year 2019. The role of four environmental variables on labour efficiency is also examined.
The analysis of the tourist areas located on the Spanish coastline shows that the impact of mass tourism on labour efficiency is uneven, with a high degree of labour inefficiency for the areas examined. The challenge is to manage the tourism sector, achieving efficiency with the resources available (Blanke and Chiesa 2008 ). This is especially important in countries such as Spain, where tourism is an important factor for development. To help in this challenge, it is important to know the most relevant inputs that explain the labour efficiency of tourist areas, these being in order of importance: the number of hotels, number of overnight stays, number of bedplaces and number of tourists. This result shows the importance of tourist resources as a lure for sun and sand tourism in Spain. This result is somewhat different from other research which shows that the impact of tourism depends to a large extent on two characteristics of the activity developed, such as the total number of arrivals and the degree of concentration of tourists at certain times of the year (Martín et al. 2017 , 2018 ). It can be said that the predominance of the sun and sand model present in Spain is not positively associated with labour efficiency, which shows that the net effect on the labour efficiency of the tourism sector in Spanish coastal areas is insignificant.
It has been found that there are important geographical differences that make it impossible to ignore the spatial perspective (Sellers-Rubio and Casado-Díaz 2018 ; Solana-Ibáñez et al. 2016 ), highlighting the complexity of the level of efficiency of the Spanish labour market. The location of tourist areas is a determining factor for efficiency, with the peninsular archipelagos of the Balearic and Canary Islands achieving the highest degree of efficiency. There is a labour imbalance that favours the tourist areas located in some of the islands that make up the archipelagos. These areas are very important sun and sand tourist markets for the country, where international tourism plays a fundamental role (Cordero and Tzeremes 2017 ). The location of the archipelagos gives them a competitive advantage over other destinations (Martín et al. 2018 ), showing that the territorial framework is especially relevant when the information analysed refers to administrative units that are not necessarily traditional labour market areas (Sánchez-Sánchez et al. 2021 ; Sánchez and Sánchez 2018 ).
The results obtained have important implications from the territorial perspective studied, the benchmarking process requires identifying the underlying causes of territorial differences. In terms of efficiency, this implies that inefficient tourist areas should examine the reasons why other areas are more efficient. Thus, the efficiency with which different tourist areas operate allows the identification of the determinants of their different levels of efficiency, which allows the value of the different strategies adopted to be measured. In particular, the results show a significant and positive impact on the efficiency of the factors number of international tourists (Hwang and Chang 2003 ; Chen 2010 ; Huang et al. 2012 ; Ben Aissa and Goaied 2016 ; Assaf et al. 2017 ; Sellers-Rubio and Casado-Díaz 2018 ), length of stay (Parte-Esteban and Alberca-Oliver 2015 ; Sellers-Rubio and Casado-Díaz 2018 ) and hotels with quality distinctions (Costa 2004 ; Claver-Cortés et al. 2007 ; Arbeló-Pérez et al. 2017 ), which highlights the importance of developing marketing strategies focused on the international tourism market, offering activities to increase the length of stay in the tourist destination and promoting commitment to quality to act as a tourist attraction. These results coincide with some studies focused on mass tourism in Spain (Baidal et al. 2013 ; Claver et al. 2007 ). The study developed provides a starting point for the analysis of factors that cause the observed differences in efficiency. The lack of information in the territorial units considered prevents the analysis of other determinants of efficiency, such as, for example, investment in advertising campaigns, the media used for marketing campaigns, the strength of the destination brand, the image of the tourist destination, etc.
The results obtained provide useful information to tourism managers, who must formulate strategies and promote employment policies with the aim of contributing to labour efficiency, improving productivity and assisting in the decision-making process of tourism managers. In Spain, institutions carry out important marketing campaigns with the aim of promoting tourist destinations and attracting new tourists, and the efficiency estimates can be taken as external benchmarks.
For future research, it would be interesting to validate the model proposed here in other countries where the demand for sun and sand tourism is similar to that of Spain, given that they are direct competitors of the country. Such a model can be extended by considering other territorial units of analysis, which could be smaller geographical units such as municipalities, cities, tourist spots, etc., in line with research such as that of Marco-Lajara et al. ( 2016 ) where hotel performance in tourist districts is analysed. It is also possible to consider the effect of the COVID-19 pandemic on the model proposed, given that the special circumstances posed by the health crisis that began in 2020, may cause significant effects on the efficiency of tourist destinations. Particularly interesting is the analysis of the determinants of performance, where factors such as the incidence rate of COVID-19, health restrictions (confinement of people, border closures or local perimeter closures), the security measures adopted by hotels or the perception of risk about the tourist destination, may have played an important role on the image of the tourist destination, affecting tourism in some areas, which may have determined the performance of tourism.
Censored sample is a sample in w hich information on the regressand is available only for some observations but not for all, although we may have information on the regressors for all the units in the sample. Further, we may have the case of runcated sample model, in which information on both the regressand and regressors is not available on some observations (see Wooldridge 2002 ).
Aigner A, Lovell CAK, Schmidt P (1977) Formulation and estimation of stochastic frontier production function models. J Econom 86:21–37
Article Google Scholar
Akbaba A (2006) Measuring service quality in the hotel industry: A study in a business hotel in Turkey. Int J Hosp Manag 25(2):170–192
Amado CAF, Santos SP, Serra JMM (2017) Does partial privatisation improve performance? Evidence from a chain of hotels in Portugal. J Bus Res 73:9–19
Andereck KL, Nyaupane GP (2011) Exploring the nature of tourism and quality of life perceptions among residents. J Travel Res 50(3):248–260
Andersen P, Petersen NC (1993) A procedure for ranking efficient units in Data Envelopment Analysis. Manage Sci 39(10):1261–1264
Arbeló A, Pérez-Gómez P, González-Dávila E, Rosa-González FM (2017) Cost and profit efficiencies in the spanish hotel industry. J Hosp Tour Res 41(8):985–1006
Arbeló-Pérez M, Arbeló A, Pérez-Gómez P (2017) Impact of quality on estimations of hotel efficiency. Tour Manage 61:200–208
Assaf AG, Barros C (2011) Performance analysis of the gulf hotel industry: A Malmquist index with bias correction. Int J Hosp Manag 30:819–826
Assaf A, Josiassen A (2012) Identifying and ranking the determinants of tourism performance: A global investigation. J Travel Res 51(4):388–399
Assaf AG, Barros CP, Josiassen A (2012) Hotel efficiency: A bootstrapped metafrontier approach. Int J Hosp Manag 31:621–629
Assaf AG, Josiassen A, Agbola FW (2015a) Attracting international hotels: Locational factors that matter most. Tour Manage 47:329–340
Assaf AG, Josiassen A, Cvelbar LK, Woo L (2015b) The effects of customer voice on hotel performance. Int J Hosp Manag 44:77–83
Assaf AG, Josiassen A, Woo L, Agbola FW, Tsionas M (2017) Destination characteristics that drive hotel performance: A state-of-the-art global analysis. Tour Manage 60:270–279
Assaf AG, Tsionas MG (2019) A review of research into performance modeling in tourism research – Launching the Annals of Tourism Research curated collection on performance modeling in tourism research. Ann Tour Res 76:266–277. https://doi.org/10.1016/j.annals.2019.04.010
Baker M, Riley M (1994) New perspectives on productivity in hotel: Some advances and new directions. Int J Hosp Manag 13:297–311
Baidal JAI, Sánchez IR, Rebollo JFV (2013) The evolution of mass tourism destinations: New approaches beyond deterministic models in Benidorm (Spain). Tour Manage 34:184–195
Balaguer J, Cantavella-Jorda M (2002) Tourism as a long-run economic growth factor: the Spanish case. Appl Econ 34(7):877–884
Barbot C, Costa A, Sochirca E (2008) Airlines Performance in the New Market Context: A Comparative Productivity and Efficiency Analysis. J Air Transp Manag 14(5):270–274
Barros CP (2005) Evaluating the efficiency of small hotel chain with a Malmquist productivity index. Int J Tour Res 7:173–184
Barros CP, Machado LP (2010) The length of stay in tourism. Ann Tour Res 37(3):692–706
Barros CP, Dieke PUC (2007) Analyzing the total productivity change in travel agencies. Tour Anal 12:27–37
Barros CP, Dieke PUC (2008) Technical efficiency of African hotels. Int J Hosp Manag 27(3):438–447
Barros C, Botti L, Peypoch N, Solonandrasana B (2011a) Managerial efficiency and hospitality industry: The Portuguese case. Appl Econ 43:2895–2905
Barros CP, Botti L, Peypoch N, Robinot E, Solonandrasana B, Assaf G (2011b) Performance of French destinations: Tourism attraction perspectives. Tour Manage 32(1):141–146
Ben Aissa S, Goaied M (2016) Determinants of tourism hotel market efficiency. Int J Cult Tour Hosp Res 10(2):173–190. https://doi.org/10.1108/IJCTHR-11-2013-0080
Benito-López B, Solana-Ibáñez J, López-Pina P (2014) Determinants of Spanish regions’ tourism performance: a two-stage, double-bootstrap data envelopment analysis. Tour Econ 20(5):987–1012
Bernini C, Guizzardi A (2010) Internal and locational factors affecting hotel industry efficiency: evidence from Italian business corporations. Tour Econ 16(4):883–913. https://doi.org/10.5367/2Fte.2010.0008
Bernini C, Guizzardi A (2016) Internal features and agglomeration externalities for the hotels’ competitiveness in Emilia-Romagna. Palgrave Macmillan, New York
Book Google Scholar
Bi G, Luo Y, Liang L (2011) Efficiency evaluation of tourism industry with Data Envelopment Analysis (DEA): A case study in China. J China Tour Res 7(1):104–116. https://doi.org/10.1080/19388160.2011.551056
Blanke J, Chiesa T (2008) The travel & tourism competitiveness Index 2008: Measuring key elements driving the sector’s development. In The Travel & Tourism Competitiveness Report 2008: Balancing Economic Development and Environmental Sustainability 3–26. Geneva, Switzerland: World Economic Forum
Bonet L (2003) Cultural Tourism. In: Towse R (ed) Handbook of Cultural Economics. Edward Elgar, pp 187–193
Google Scholar
Botti L, Peypoch N, Solonandrasana B (2008) Time and tourism attraction. Tour Manage 29(3):594–596
Boyer M (1999) Histoire du turisme de masse. Presses Universitaires de France, Paris
Brida JG, Garrido N, Deidda M, Pulina M (2012) Exploring the dynamics of the efficiency in the Italian hospitality sector. A regional case study. Expert Syst Appl 39(10):9064–9071. https://doi.org/10.1016/j.eswa.2012.02.045
Brown JR, Ragsdale CT (2002) The competitive market efficiency of hotel brands: An application of data envelopment analysis. J Hosp Tour Res 26(4):260–332
Casado-Díaz AB, Sellers-Rubio R (2020) The effect of short-term rentals on regional hotel efficiency. Curr Issue Tour. https://doi.org/10.1080/13683500.2020.1857348
Charnes AW, Cooper WW, Rhodes E (1978) Measuring the efficiency of decision making units. Eur J Oper Res 2:429–444
Chen TH (2009) Performance measurement of an enterprise and business units with an application to a Taiwanese hotel chain. Int J Hosp Manag 28(3):415–422
Chen MH (2010) The economy, tourism growth and corporate performance in the Taiwanese hotel industry. Tour Manage 31(5):665–675
Chen MH (2011) The response of hotel performance to international tourism development and crisis events. Int J Hosp Manag 30:200–212
Chen WJ (2013) Factors influencing internal service quality at international tourist hotels. Int J Hosp Manag 35:152–160
Chen S, Chen HH, Zhang KQ, Xu X-L (2018) A comprehensive theoretical framework for examining learning effects in green and conventionally managed hotels. J Clean Prod 174:1392–1399
Chiang WE (2006) A hotel performance evaluation of Taipei international tourist hotels using data envelopment analysis. Asia Pac J Tour Res 11(1):29–42
Claver-Cortés E, Molina-Azorín JF, Pereira-Moliner J (2007) The impact of strategic behaviors on hotel performance. Int J Contemp Hosp Manag 19(1):6–20
Claver E, Molina JF, Pereira J (2007) Competitiveness in mass tourism. Ann Tour Res 34(3):727–745
Claver E, Tari JJ, Pereira J (2006) Does quality impact on hotel performance? Int J Contemp Hosp Manag 18(4):350–358
Coelli T, Prasada Rao DS, O’Donnell CJ, Battese GE (1998) An introduction to efficiency and productivity analysis. Kluwer Academic Publishers, Boston
Cordero JM, Tzeremes NG (2017) Evaluating hotel productivity growth in Balearic and Canary islands. Tour Econ 23(5):1146–1154. https://doi.org/10.1177/2F1354816616683051
Costa J (2004) The Portuguese tourism sector: Key challenges for human resources management. Int J Contemp Hosp Manag 16(7):402–407
Crouch GI (2011) Destination competitiveness: An analysis of determinant attributes. J Travel Res 50(1):27–45
Cvetkosa V, Barišić P (2017) The efficiency of the tourism industry in the Balkans. Proceedings of the Faculty of Economics in East Sarajevo 14:31–41
De Carlos Villamarín P, Domínguez Vila T, Alén González E (2016) Análisis del desempeño de destinos litorales españoles a través de la evolución de la demanda y la oferta de alojamiento. Innovar 26(59):137–154. https://doi.org/10.15446/innovar.v26n59.54368
De Jorge J, Suárez C (2014) Productivity, efficiency and its determinant factors in hotels. Serv Ind J 34(4):354–372. https://doi.org/10.1080/02642069.2013.778977
Deng Y, Veiga H, Wiper MP (2019) Efficiency evaluation of hotel chains: a Spanish case study. Series 10:115–139. https://doi.org/10.1007/s13209-019-0188-6
Deprest F (1997) Enquête sur le turisme de masse. L’écologie face su territoire. Belin, Paris
Detotto C, Pulina M, Brida JG (2014) Assessing the productivity of the Italian hospitality sector: A post-WDEA pooled-truncated and spatial analysis. J Prod Anal 42:103–121
Dragan D, Keshavarzsaleh A, Jereb B, Topolšek D (2018) Integration with transport suppliers and efficiency of travel agencies. Int J Value Chain Manag 9(2):122–148
Faleye O, Kovacs T, Venkateswaran A (2014) Do better-connected CEOs innovate more? J Finane Quant Anal 49(5–6):1201–1225
Farmaki A (2012) An exploration of tourist motivation in rural settings: the case of Troodos, Cyprus. Tour Manag Perspect 2–3:72–78. https://doi.org/10.1016/j.tmp.2012.03.007
Fernández MA, Becerra R (2015) An analysis of Spanish hotel efficiency. Cornell Hosp Q 56(3):248–257
Fried HO, Lovell CAK, Schmidt S (2008) The Measurement of Productive Efficiency and Productivity Growth. Oxford University Press, Oxford
Fuentes R (2011) Efficiency of travel agencies: A case study of Alicante. Tour Manage 32(1):75–87
Greene W (2004) Fixed effects and bias due to the incidental parameters problem in the Tobit model. Economet Rev 23(2):125–147
Gu Z (2004) Management Science Applications in Tourism and Hospitality, Taylor & Francis Group. ProQuest Ebook Central. https://ebookcentral.proquest.com/lib/bupo-ebooks/detail.action?docID=1603846
Guetat H, Jarboui S, Boujelbene Y (2015) Evaluation of hotel industry performance and corporate governance: a stochastic frontier analysis. Tour Manag Perspect 15:128–136
Hadad S, Hadad Y, Malul M, Rosenboim M (2012) The economic efficiency of the tourism industry: A global comparison. Tour Econ 18(5):931–940
Higuerey A, Viñan-Merecí C, Malo-Montoya Z, Martínez-Fernández V-A (2020) Data Envelopment Analysis (DEA) for Measuring the Efficiency of the Hotel Industry in Ecuador. Sustainability 12(4):1590. https://doi.org/10.3390/su12041590
Huang Y, Mesak HI, Hsu MK, Qu H (2012) Dynamic efficiency assessment of the Chinese hotel industry. J Bus Res 65:59–67
Hwang SN, Chang TY (2003) Using data envelopment analysis to measure hotel managerial efficiency change in Taiwan. Tour Manage 24(4):357–369
Hwang SN, Chang TY (2016) Formulating management strategy for international tourist hotel using DEA. In: Zhu J (ed) Data Envelopment Analysis. Springer, pp 289–316
Chapter Google Scholar
IET (2013) Balance del Turismo en España. Año 2012. Madrid: Instituto de Estudios Turísticos
INE (2019) Cuenta satélite del turismo de España. Año 2019 . Madrid: Instituto Nacional de Estadística
Ismail J, Dalbor M, Mills J (2002) Using RevPar to analyse lodging- segment variability. Cornell Hotel Restaur Adm Q 43:73–80
Ivanov S, Zhechev V (2012) Hotel revenue management – A critical literature review. Tourism 60(2):175–197. https://doi.org/10.2139/ssrn.1977467
Jedrzejczak MF (2004) The modern tourist’s perception of the beach: Is the sandy beach a place of conflict between tourism and biodiversity? Coastline Rep 2:109–119
Johns N, Howcroft B, Drake L (1997) The use of data envelopment analysis to monitor hotel productivity. Prog Tour Hosp Res 3:119–127
Karakitsiou A, Kourgiantakis M, Mavrommati A, Migdalas A (2018) Regionale efficiency evaluation by input-oriented data envelopment analysis of hotel and restaurant sector. Oper Res Int Journal 24:1–18
Karatepe O (2012) Perceived organizational support, career satisfaction, and performance outcomes: A study of hotel employees in Cameroon. Int J Contemp Hosp Manag 24(5):735–752
Kim S (2011) Factor determinants of total factor productivity growth in the Malaysian hotel industry: a stochastic frontier approach. Cornell Hosp Q 52(1):35–47
Kularatne T, Wilson C, Månsson J, Hoang V, Lee B (2019) Do environmentally sustainable practices make hotels more efficient? A study of major hotels in Sri Lanka. Tour Manage 71:213–225. https://doi.org/10.1016/j.tourman.2018.09.009
Lado-Sestayo R, Otero-González L, Vivel-Búa M, Martorell-Cunill O (2016) Impact of location on profitability in the Spanish hotel sector. Tour Manage 52:405–415
Lado-Sestayo R, Fernández-Castro AS (2019) The impact of tourist destination on hotel efficiency: A data envelopment analysis approach. Eur J Oper Res 272(2):674–686. https://doi.org/10.1016/j.ejor.2018.06.043
Lee CC, Lin SZ, You SM, Shang JK (2012) A comparison of regular and franchise systems in the real estate brokerage industry in terms of operating efficiency application of the data envelopment analysis. Afr J Bus Manage 6(25):7431–7438
Ley-Vega C, Gallego-Fernández JB, Vidal Pascual C (2007) Manual de Restauración de Dunas Costeras. Gobierno de España, Ministerio de Medio Ambiente, Madrid, p 251
Li X, Sanders K, Frenkel S (2012) How leader-member exchange, work engagement and HRM consistency explain Chinese luxury hotel employees’ job performance. Int J Hosp Manag 31:1059–1066
Li CT, Zhang JB, Zhang X (2020) Annual report readability and corporate innovation. Bus Manag J 42(10):156–173
Liu J, Zhang J, Fu Z (2017) Tourism eco-efficiency of Chinese coastal cities – Analysis based on the DEA-Tobit model. Ocean Coast Manag 148:164–170. https://doi.org/10.1016/j.ocecoaman.2017.08.003
Long PH (2011) Perceptions of tourism impact and tourism development among residents of Cuc Phuong National Park, Ninh Binh. Vietnam J Ritsumeikan Social Sciences and Humanities 3:75–92
López-Fernández MC, Serrano-Bedia AM (2004) Is the hotel classification system a good indicator of hotel quality? An application in Spain. Tour Manage 25:771–775
Lovell CAK (1993) Production frontiers and productive efficiency. In: Fried HO, Lovell CKA, Schmidt SS (eds) The measurement of productivity efficiency: Techniques and applications. Oxford University Press, New York, pp 3–67
Lozano S, Gutierrez E (2011) Efficiency analysis of EU-25 member states as tourist destinations. Int J Serv Technol Manage 15(1–2):69–88
Manasakis C, Apostolakis A, Datseris G (2013) Using data envelopment analysis to measure hotel efficiency in Crete. Int J Contemp Hosp Manag 25(4):510–535
Marco-Lajara B, Úbeda-García M, Sabater-Sempere V, García-Lillo F (2014) Territory impact on the performance of Spanish vacation hotels. Tour Econ 20(4):779–796
Marco-Lajara B, Claver-Cortés E, Úbeda-García M, Zaragoza-Sáez PC (2016) Hotel performance and agglomeration of tourist districts. Reg Stud 50(6):1016–1035
Martín JM, Rodríguez JA, Zermeño K, Salinas JA (2018) Effects of vacation rental websites on the concentration of tourists. Potential environmental impacts. An application to the Balearic Islands in Spain. Int J Environ Res Pub Health 15:347. https://doi.org/10.3390/ijerph15020347
Martin JM, Salinas JA, Rodríguez JA, Jiménez JD (2017) Assessment of the tourism’s potential as a sustainable development instrument in terms of annual stability: Application to Spanish rural destinations in process of consolidation. Sustainability 9(10):1692
Martin JM, Salinas JA, Rodríguez JA (2018) Comprehensive evaluation of the tourism seasonality using a synthetic DP2 indicator. Tour Geogr 1–22. https://doi.org/10.1080/14616688.2018.1505943
Mazanec JA, Wöber K, Zins AH (2007) Tourism destination competitiveness: From definition to explanation? J Travel Res 46(1):86–95
Meeusen W, Van den Broeck J (1977) Efficiency estimation from Cobb-Douglas production function with composed error. Int Econ Rev 18:435–444
Núñez-Serrano JA, Turrión J, Velázquez FJ (2014) Are stars a good indicator of hotel quality? Asymmetric information and regulatory heterogeneity in Spain. Tour Manage 42:77–87
Ohe Y, Peypoch N (2016) Efficiency analysis of Japanese Ryokans A window DEA approach. Tour Econ 22(6):1261–1273
Oliveira R, Pedro MI, Marques RC (2013a) Efficiency and its determinants in Portuguese hotels in the Algarve. Tour Manage 36:641–649
Oliveira R, Pedro MI, Marques RC (2013b) Efficiency performance of the Algarve hotels using a revenue function. Int J Hosp Manag 35:59–67
Oral M, Yolalan R (1990) An empirical study on measuring operating efficiency and profitability of bank branc. Eur J Oper Res 46(3):282–294
Oukil A, Channouf N, Al-Zaidi A (2016) Performance evaluation of the hotel industry in an emerging tourism destination: The case of Oman. J Hosp Tour Manag 29:60–68
Parte-Esteban L, Alberca-Oliver P (2015) Determinants of technical efficiency in the Spanish hotel industry: regional and corporate performance factors. Curr Issue Tour 18(4):391–411. https://doi.org/10.1080/13683500.2013.800029
Pérez S (2010) El valor estratégico del turismo rural como alternativa sostenible de desarrollo territorial rural. Agronomía Colombiana 28(3):507–513
Perrigot R, Barros CP (2008) Technical efficiency of French retailers. J Retail Consum Serv 15(4):296–305
Perrigot R, Cliquet G, Piot-Lepetit I (2009) Plural form chain and efficiency: Insights from the French hotel chains and the DEA methodology. Eur Manag J 27(4):268–280
Poon A (1993) Tourism, technology and competitive strategies. CABI, Wallingford
Poldrugovac K, Tekavcic M, Jankovic S (2016) Efficiency in the hotel industry: An empirical examination of the most influential factors. Econ Res 29:583–597. https://doi.org/10.1080/1331677X.2016.1177464
Pou L (2012) Turismo y empleo: Una mirada realista. J Pub Policies and Territories 1(3):39–44
Ramírez-Hurtado JM, Contreras I (2017) Efficiency of travel agency franchises: a study in Spain. Serv Bus 11:717–739. https://doi.org/10.1007/s11628-016-0326-1
Rosenbaum SM, Spears DL (2006) An exploration of spending behaviors among Japanese tourists. J Travel Res 44(4):467–473
Sakthidharan V, Sivaraman S (2018) Impact of operating cost components on airline efficiency in India: A DEA approach. Asia Pac Manag Rev 23(4):258–267. https://doi.org/10.1016/j.apmrv.2017.12.001
Sánchez AM, Sánchez FJ (2018) Impacto del turismo rural sobre el empleo en España: una aproximación a escala provincial. Cuad de Desarro Rural 15(82):1–19. https://doi.org/10.11144/Javeriana.cdr15-82.itre
Sánchez-Sánchez FJ, Sánchez-Sánchez AM (2021) Medición de la eficiencia laboral del turismo rural sostenible en espacios naturales protegidos de España. Investigaciones turísticas 22:200–230. https://doi.org/10.14198/INTURI2021.22.9
Sánchez-Sánchez FJ, Sánchez-Sánchez AM, Pulido N, Borrero DV (2021) Measuring the labour efficiency in Andalusia (Spain): A DEA approach. J Region Res 49:113–130. https://doi.org/10.38191/iirr-jorr.21.005
Santana-Jiménez Y, Hernández JM (2011) Estimating the effect of overcrowding on tourist attraction: the case of Canary Islands. Tour Manage 32(2):415–425. https://doi.org/10.1016/j.tourman.2010.03.013
Seiford LM (1997) A bibliography for data envelopment analysis (1978–1996). Ann Oper Res 73:393–438
Sellers-Rubio R, Casado-Díaz AB (2018) Analyzing hotel efficiency from a regional perspective: The role of environmental determinants. Int J Hosp Manag 75:75–85
Shieh HS (2012) The greener, the more cost efficient? An empirical study of international tourist hotels in Taiwan. Int J Sustain Dev World Ecol 19(6):536–545
Shirazi F, Mohammadi E (2019) Evaluating efficiency of airlines: A new robust DEA approach with undesirable output. Res Transp Bus Manag 33:100467. https://doi.org/10.1016/j.rtbm.2020.100467
Sigala M, Airey D, Jones P, Lockwood A (2004) ICT paradox lost? A stepwise DEA methodology to evaluate technology investments in tourism settings. J Travel Res 43:180–192
Singh AK (2011) Performance Evaluation of Indian Airline Industry: An Application of DEA. Asia Pac Bus Rev 7(2):92–103. https://doi.org/10.1177/097324701100700209
Solana-Ibáñez J, Caravaca-Garratón M, Para-González L (2016) Two-stage data envelopment analysis of Spanish regions: Efficiency determinants and stability analysis. Contemporary Economics 10(3):259–274
Soysal-Kurt H (2017) Measuring tourism efficiency of european countries by using Data Envelopment Analysis. Eur Sci J 13(10):31–49
Such-Devesa MJ, Mendieta-Peñalver LF (2013) Research note: Size, efficiency and productivity in the Spanish hotel industry. Independent properties versus chain-affiliated hotels. Tour Econ 19(4):801–809. https://doi.org/10.5367/2Fte.2013.0320
Tavares G (2002) A bibliography of data envelopment analysis (1978–2001). Rutcor Res Rep 1–2
Tsai H, Song HY, Wong KKF (2009) Tourism and hotel competitiveness research. J Travel Tour Mark 26(5–6):522–546
UNWTO (2017) Tourism Highlights. Available at: https://www.e-unwto.org/doi/pdf/10.18111/9789284419029 (accessed 12 February 2018)
Wang FC, Hung WT, Shang JK (2006) Measuring pure managerial efficiency of international tourist hotels in Taiwan. Serv Ind J 26(1):59–71
Wang YH, Lee WF, Wong CC (2007) Productivity and efficiency analysis of international tourist hotels in Taiwan: An application of the stochastic frontier approach. Taiwan Economic Review 35:7–114
Wassenaar K, Stafford ER (1991) The lodging index: An economic indicator for the hotel motel industry. J Travel Res 30:18–21
Williams A (2011) Definitions and typologies of coastal tourism beach destinations. In Disappearing destinations: Climate change and future challenges for coastal tourism (pp. 47-65). Wallingford UK: Cabi
Williams C, Buswell J (2003) Service Quality in Leisure and Tourism. CABI, Wallingford
Wooldridge JM (2002) Econometric Analysis of Cross section and Panel data. Massachusetts Institute of Technology
Xiao Q, O’Neill JW, Mattila AS (2012) The role of hotel owners: The influence of corporate strategies on hotel performance. Int J Contemp Hosp Manag 24(1):122–139
Yang Z, Cai J (2016) Do regional factors matter? Determinants of hotel industry efficiency in China. Tour Manage 52:242–253
Yi T, Liang M (2015) Evolutional Model of Tourism Efficiency Based on the DEA Method: A Case Study of Cities in Guangdong Province, China. Asia Pacific Journal of Tourism Research 20(7):789–806. https://doi.org/10.1080/10941665.2014.932294
Yu H, Zhang Y, Zhang A, Wang K, Cui A (2019) A comparative study of airline efficiency in China and India: A dynamic network DEA approach. Res Transp Econ 76:100746. https://doi.org/10.1016/j.retrec.2019.100746
Yuan J, Liu Y (2020) Evaluation of tourism efficiency in the coastal areas of China in the context of the happiness industry. In: Zheng, C.W.; Wang, Q.; Zhan, C., and Yang, S.B. (eds.). Air-Sea Interaction and Coastal Environments of the Maritime and Polar Silk Roads. J Coast Res 99:144–150
ZhiYi H (2015) An analysis of the efficiency characteristics of the travel agency industry of China based on a DEA-Malmquist model. Tourism Tribune 30(5):23–30
Download references
Acknowledgements
Funding for open access publishing: Universidad Pablo de Olavide/CBUA.
Open Access funding provided thanks to the CRUE-CSIC agreement with Springer Nature.
Author information
Authors and affiliations.
Universidad Pablo de Olavide, Ctra. Utrera Km 1. ES, 41013, Sevilla, España
Francisca J. Sánchez-Sánchez & Ana M. Sánchez-Sánchez
You can also search for this author in PubMed Google Scholar
Corresponding author
Correspondence to Francisca J. Sánchez-Sánchez .
Ethics declarations
Ethical approval.
This article does not contain any studies with human participants or animals performed by any of the authors.
Conflict of interest
The authors declare that they has no conflict of interest.
Additional information
Publisher's note.
Springer Nature remains neutral with regard to jurisdictional claims in published maps and institutional affiliations.
Rights and permissions
This article is published under an open access license. Please check the 'Copyright Information' section either on this page or in the PDF for details of this license and what re-use is permitted. If your intended use exceeds what is permitted by the license or if you are unable to locate the licence and re-use information, please contact the Rights and Permissions team .
About this article
Sánchez-Sánchez, F.J., Sánchez-Sánchez, A.M. Evaluating the efficiency and determinants of mass tourism in Spain: a tourist area perspective. Port Econ J 23 , 111–145 (2024). https://doi.org/10.1007/s10258-022-00228-9
Download citation
Received : 09 February 2022
Accepted : 21 October 2022
Published : 12 December 2022
Issue Date : January 2024
DOI : https://doi.org/10.1007/s10258-022-00228-9
Share this article
Anyone you share the following link with will be able to read this content:
Sorry, a shareable link is not currently available for this article.
Provided by the Springer Nature SharedIt content-sharing initiative
- Mass tourism
- Environmental factors
- Find a journal
- Publish with us
- Track your research
TheJakartaPost
Please Update your browser
Your browser is out of date, and may not be compatible with our website. A list of the most popular web browsers can be found below. Just click on the icons to get to the download page.
- Destinations
- Jakpost Guide to
- Newsletter New
- Mobile Apps
- Tenggara Strategics
- B/NDL Studios
- Archipelago
- Election 2024
- Regulations
- Asia & Pacific
- Middle East & Africa
- Entertainment
- Arts & Culture
- Environment
- Work it Right
- Quick Dispatch
- Longform Biz
Overtourism sparks backlash in Spain
Rallying under the slogan "The Canaries have a limit", a collective of groups on the archipelago off northwest Africa are planning a slew of protests on Saturday.
Share This Article
Change size.

nti-tourism movements are multiplying in Spain, the world's second most visited country, prompting authorities to try and reconcile the interests of locals and the lucrative sector.
The Canaries are known for volcanic landscapes and year-round sunshine and attracts millions of visitors from all over the world.
Groups there want authorities to halt work on two new hotels on Tenerife, the largest and most developed of the archipelago's seven islands.
They are also demanding that locals be given a greater say in the face of what they consider uncontrolled development which is harming the environment.
Several members of the collective "Canaries Sold Out" also began an "indefinite" hunger strike last week to put pressure of the authorities.
"Our islands are a treasure that must be defended," the collective said.
The Canaries received 16 million visitors last year, more than seven times its population of around 2.2 million people.
This is an unsustainable level given the archipelago's limited resources, Victor Martin, a spokesman for the collective told a recent press briefing, calling it a "suicidal growth model".
'Go home'
Similar anti-tourism movements have sprung up elsewhere in Spain and are active on social media.
In the southern port of Malaga on the Costa del Sol, a centre of Spain's decades-old "soy y playa" or "sun and beach" tourism model, stickers with unfriendly slogans such as "This used to be my home" and "Go home" have appeared on the walls fn doors of tourist accommodations.
In Barcelona and the Balearic Islands, activists have put up fake signs at the entrances to some popular beaches warning in English of the risk of "falling rocks" or "dangerous jellyfish".
Locals complain a rise in listings of accommodation on short-term rental platforms such as Airbnb have worsened a housing shortage and caused rents to soar, especially in town centres.
The influx of tourists also adds to noise and environmental pollution and taxes resources such as water, they add.
In the northeastern region of Catalonia, which declared a drought emergency in February, anger is growing over the pressure exerted on depleted water reserves by hotels on the Costa Brava.
"There are tourist destinations that are at the limits of their capacity," said Jose Luis Zoreda, the vice president of tourism association Exceltur .
"It's a problem that appears occasionally in the high season and in certain parts of the country, but it's getting worse".
Loudspeaker ban
Before the Covid-19 pandemic brought the global travel industry to its knees in 2020, protest movements against overtourism had already emerged in Spain, especially in Barcelona.
Now that pandemic travel restrictions have been lifted, tourism is back with a vengeance -- Spain welcomed a record 85.1 million foreign visitors last year.
In response, several cities have taken measures to try to limit overcrowding.
The northern seaside city of San Sebastian last month limited the size of tourist groups in the centre to 25 people and banned the use of loudspeakers during guided tours.
The southern city of Seville is mulling charging non-residents a fee to enter its landmark Plaza de Espana while Barcelona had removed a bus route popular with tourists from Google Maps to try to make more room for locals.
Housing Minister Isabel Rodriguez said over the weekend that "action needs to be taken to limit the number of tourist flats" but stressed the government is "aware of the importance of the tourist sector", which accounts for 12.8 percent of Spain's Gross Domestic Product.

Ministry orders remote working for civil servants to help ease traffic congestion

Netanyahu vows victory after Iran strikes, fears of wider conflict grow

18 people killed in South Sulawesi landslide
Related articles, south korea to send military doctors to hospitals amid doctors' protest, white collar workers hold protest in scbd, students to stage protest against alleged election interference, resisting colonial rule: an anecdote of borneo’s remaining sultanate, spain's hermoso defends rubiales kiss at women's world cup, related article, more in culture.

Joko Anwar horror flick 'Siksa Kubur' attracts 1.4 million moviegoers

NASA unveils probe bound for Jupiter's possibly life-sustaining moon

Iran says any action against its interests will get a severe response

The open ESG flank

Who is Lawrence Wong, Singapore's guitar-wielding next leader?
Military urged to cut presence, use of force in papua, pik 2 race circuit must not repeat mandalika's ‘issues’, govt to closely monitor economic impacts of mideast escalation: airlangga, outgoing prime minister lee to serve as singapore's senior minister, apple ceo to visit indonesia this week, minister say, rupiah has weak start against dollar after idul fitri holiday, wang yi to visit indonesia, cambodia and papua new guinea.
- Jakpost Guide To
- Art & Culture
- Today's Paper
- Southeast Asia
- Cyber Media Guidelines
- Paper Subscription
- Privacy Policy
- Discussion Guideline
- Term of Use
© 2016 - 2024 PT. Bina Media Tenggara
Your Opinion Matters
Share your experiences, suggestions, and any issues you've encountered on The Jakarta Post. We're here to listen.
Thank you for sharing your thoughts. We appreciate your feedback.
Tourism in Spain
Disclaimer: Some posts on Tourism Teacher may contain affiliate links. If you appreciate this content, you can show your support by making a purchase through these links or by buying me a coffee . Thank you for your support!
Tourism in Spain is big business! But why is tourism here so important and why does it matter? Read on to find out…
Geography in Spain
Statistics on tourism in spain, popular tourist attractions in spain, popular types of tourism in spain, economic impacts of tourism in spain, social impacts of tourism in spain, environmental impacts of tourism in spain, faqs about tourism in spain, to conclude: tourism in spain.
Spain is a country located in southwestern Europe on the Iberian Peninsula. It is bordered by Portugal to the west, France and Andorra to the northeast, and the Mediterranean Sea to the east and south. The country has a diverse geography that includes several mountain ranges, plateaus, rivers, and coasts.
The two dominant mountain ranges in Spain are the Pyrenees, which separate Spain from France, and the Sistema Central, which runs through the centre of the country. The highest peak in Spain is Mount Teide, located on the island of Tenerife in the Canary Islands.
Spain’s two major rivers are the Tagus and the Ebro. The Tagus is the longest river on the Iberian Peninsula and flows through Portugal before emptying into the Atlantic Ocean at Lisbon. The Ebro flows through northeastern Spain and empties into the Mediterranean Sea.
Spain has several plateaus, including the Meseta Central, which covers a large part of the country’s interior, and the Basque-Cantabrian Mountains in the north. The country’s coasts are mostly rocky, with several sandy beaches along the Mediterranean coast and the Atlantic beaches in the north of the country.
Spain has a range of climates due to its varied geography. The northern coast and mountainous regions have a temperate climate with mild summers and cold winters, while the central plateau has hot, dry summers and cold winters. The Mediterranean coast has mild winters and hot, dry summers, while the Canary Islands have a subtropical climate with warm temperatures year-round.
Tourism is a significant industry in Spain and has been a major contributor to the country’s economic growth. Spain is one of the world’s most popular tourist destinations and receives millions of visitors every year, making it a top destination in Europe.
The tourism industry is a major employer in Spain, providing millions of jobs to workers in the sector. In 2019, tourism accounted for over 11% of Spain’s GDP and generated over 92 billion euros in revenue.

Spain has a diverse range of tourism offerings, including cultural tourism, gastronomic tourism, beach tourism, and outdoor activities like hiking and skiing. Popular tourist destinations in Spain include Barcelona, Madrid, the Costa del Sol, the Balearic and Canary Islands, and Andalusia.
The country has a well-established infrastructure to support the tourism industry, including modern airports and high-speed train networks. Additionally, Spain has a wide range of accommodation options, from luxury hotels to backpacker hostels.
Spain has also been working to promote sustainable tourism practices, such as eco-tourism, responsible tourism, and cultural tourism that respect the country’s cultural and natural heritage. In recent years, the Spanish government has made significant efforts to improve and modernise tourism infrastructure and increase investment in the tourism sector.
Now lets take a look at some statistics that emphasise the scale of tourism in Spain:
In 2019, Spain welcomed a total of 83.7 million international tourists, which was a record high and a 1.1% increase from the previous year.
The largest number of international visitors in Spain come from the United Kingdom, followed by Germany, France, and the Nordic countries.
The most popular tourist regions in Spain are Catalonia, the Balearic Islands, Andalusia, and the Canary Islands.
In terms of tourism revenue, Spain generated over 92 billion euros in 2019, which represented an increase of 2.8% from the previous year.
Tourism accounted for 11.7% of Spain’s GDP in 2019, making it a key contributor to the country’s economy.
Accommodation is a significant part of the tourism industry in Spain. In 2020, the country had over 17,000 registered hotels, with a total of almost 2 million rooms.
In 2020, due to the COVID-19 pandemic, the number of international tourists visiting Spain decreased significantly to 19 million, which represented a 77% decrease compared to the previous year.
The Spanish government has stated a goal of attracting 100 million international visitors to the country by the end of 2021, which would represent a return to pre-pandemic levels.
Spain has a wealth of tourist attractions, ranging from famous cultural landmarks to stunning natural landscapes. Here are some of the most popular tourism attractions in Spain:
La Sagrada Familia – This famous basilica in Barcelona is a masterpiece of architect Antoni Gaudí, with its unique and elaborate neo-Gothic design.
Park Güell – Another notable creation of Antoni Gaudí, the park features stunning mosaics and sculptures surrounded by beautiful landscaped gardens.
The Alhambra – This palace and fortress in Granada is a UNESCO World Heritage site, renowned for its exquisite Moorish architecture and stunning gardens.
La Rambla – A lively promenade in the heart of Barcelona, La Rambla is lined with street performers, cafes, and shops, making it a prime tourist hotspot.
The Prado Museum – Madrid’s most famous art museum displaying works from renowned artists such as Goya, Velázquez, and El Greco.

The Guggenheim Museum – This iconic museum in Bilbao is instantly recognizable for its avant-garde, titanium-clad design and a remarkable collection of contemporary art.
The Camino de Santiago – A world-famous walking trail that spans across northern Spain, ending at the Cathedral of Santiago de Compostela in Galicia.
The Costa del Sol – The sunny coast of southern Spain is dotted with resorts and golden sandy beaches that attract millions of tourists every year.
The Canary Islands – This Spanish territory, located off the coast of Africa, is known for its warm year-round climate, scenic landscapes, and black sand beaches.
La Tomatina – A unique annual festival held in Valencia, where locals and visitors engage in a massive tomato fight on the streets.
These are just a few examples of the many attractions that Spain has to offer tourists, as there are countless other sites across the country that showcase the amazing cultural, historic, and environmental treasures of Spain.
Now lets take a look at the most popular types of tourism in Spain:
- Cultural tourism – Spain is known for its rich cultural heritage, with historical landmarks such as the Alhambra palace, the Sagrada Familia church, and the ancient Roman ruins throughout the country.
- Beach tourism – Spain boasts 8,000 km of coastline, making it a paradise for beach lovers. The most popular beach destinations in Spain are the Costa del Sol, the Costa Brava, and the Canary Islands.
- Gastronomic tourism – Spain is a country that offers a high level of culinary expertise, with gastronomic delights such as tapas, paella, and Rioja wines. Some of the most popular destinations for foodies include San Sebastian, Madrid and Barcelona.
- Adventure tourism – Spain offers activities for adrenaline-seekers, including rock climbing, canyoning, caving, and skiing in the Pyrenees mountain range.

- Wine tourism – Spain has many regions that produce excellent wines, such as Rioja, Ribera del Duero, and Priorat. Wine enthusiasts can visit vineyards, taste wines and learn about the wine-making process.
- Nature tourism – Spain is home to several picturesque natural areas, such as the Picos de Europa National Park, the Canary Island nature reserves, and the Camino de Santiago walking trail.
- Festivals and events tourism – Spain hosts several unique events throughout the year, such as the Running of the Bulls in Pamplona or La Tomatina in Valencia.
These are just some of the popular types of tourism in Spain that attract visitors from near and far, and Spain continues to offer a wide range of activities and experiences for tourists.
Tourism is a significant industry in Spain, contributing significantly to the country’s overall economic growth. Here are some of the major economic impacts of tourism in Spain:
Job Creation – The tourism industry is a major employer in Spain. In 2019, the sector generated 2.7 million jobs, accounting for 14% of total employment in the country.
Gross Domestic Product (GDP) – Tourism is a significant contributor to the Spanish economy, accounting for 11% of GDP in 2019. The industry generated over 92 billion euros in revenue in the same year.
Trade – Tourism helps to boost Spain’s trade and export industry. In 2019, international tourism brought in more than 67 billion euros in export revenue.
Investment – The tourism industry attracts significant foreign investment to Spain. In 2019, the country received 6.9 billion euros in foreign direct investment related to tourism.
Regional Development – Tourism plays a significant role in the development of many regions and cities in Spain. The industry provides economic incentives to improve infrastructure, promote local businesses and support the sustainability of natural and cultural heritage.
Spain is one of the most popular tourist destinations in the world, with around 83 million visitors each year. While tourism brings significant economic benefits to the country, it also has social impacts.
Here are some of the social impacts of tourism in Spain:
- Overcrowding: One of the biggest social impacts of tourism in Spain is overcrowding. During the high tourist season, beaches, streets, and tourist attractions can become overcrowded, which can cause inconvenience and frustration for both locals and tourists.
- Cultural changes: The influx of tourists can lead to cultural changes in Spain. For example, the increasing presence of tourists can lead to the commodification of local culture, and the adoption of more globalised tourism practices can lead to the loss of local traditions and customs.
- Strains on infrastructure: High levels of tourism can put a strain on infrastructure, such as roads, public transport, and water supply systems. This can not only inconvenience locals, but also negatively impact the environment.
- Employment and wage inequality: While tourism can create job opportunities, there can be issues with wage inequality and precarious work. Many jobs in the tourism industry are low-paid and seasonal, which can lead to social and economic disparities.
- Social conflict: The presence of tourists can sometimes lead to social conflict, as locals may feel that their neighbourhoods or culture are being overrun. In some cases, this can lead to resentment and tension between locals and visitors.
Overall, while tourism brings significant economic benefits to Spain, it is important to consider and mitigate the social impacts it may have on local communities.
Tourism can have a significant impact on the environment in Spain due to the large number of visitors and the demand for resources that tourism creates. Here are some of the environmental impacts of tourism in Spain:
- Overuse of resources: The high demand for resources such as water, energy, and food can strain local ecosystems and lead to overuse of resources. This can also lead to environmental problems such as pollution and deforestation.
- Waste production: Tourist activity generates a large amount of waste, which can affect the quality of soil, water, and air. The waste generated by hotels, restaurants, and other tourist facilities must be properly managed to prevent environmental damage.
- Carbon emissions: The transport, accommodation, and activities associated with tourism are significant sources of carbon emissions, contributing to climate change. The high volume of air travel in particular is a major contributor to carbon emissions.
- Damage to natural habitats: Tourists often visit natural areas such as national parks, beaches, and mountains. Increased tourism activity can lead to environmental damage and the destruction of natural habitats, especially where there is uncontrolled development.
- Water scarcity: In areas where water resources are already limited, tourism can exacerbate water scarcity problems. Tourist activities such as swimming pools, golf courses, and irrigation systems can place additional strain on already limited water resources.
It is important for tourism stakeholders in Spain to prioritise sustainability practices and environmental management to ensure the long-term preservation of ecosystems and natural resources.

Now that we know a bit more about tourism in Spain, lets answer some of the most common questions on this topic:
1 – Is it safe to travel to Spain?
Yes, Spain is generally considered a safe country to travel to. However, visitors should always exercise caution and take precautions to avoid pickpocketing and other petty crimes, particularly in tourist areas.
2 – What is the best time of year to visit Spain?
The best time to visit Spain depends on the region and the activities planned. Generally, the spring and fall months are ideal as the weather is still warm and the crowds are smaller.
3 – What is the currency in Spain?
The currency used in Spain is the euro (EUR).
4 – Do I need a visa to travel to Spain?
Visa requirements depend on your country of origin. Citizens of certain countries, including the United States, Canada, and Australia, can travel to Spain without a visa for up to 90 days.
5 – What are the most popular tourist destinations in Spain?
The most popular tourist destinations in Spain include Barcelona, Madrid, Valencia, the Costa del Sol, and the Balearic Islands.
6 – What is the official language of Spain?
The official language of Spain is Spanish (Castilian), but other regional languages such as Basque, Catalan, and Galician are also spoken.
7 – What are some traditional Spanish dishes?
Traditional Spanish dishes include paella, tortilla de patatas (potato omelette), gazpacho (cold tomato soup), and churros (sweet fried dough).
8 – What is the nightlife like in Spain?
Spain is known for its vibrant nightlife, with many bars, clubs, and restaurants staying open late into the night.
9 – How can I get around in Spain?
Spain has an extensive network of public transportation, including buses, trains, and subways. Taxis, rental cars, and ride-sharing apps are also available.
10 – Is tipping expected in Spain?
Tipping is not expected in Spain, as a service charge is typically included in restaurant bills. However, rounding up to the nearest euro is a common practice.
As you can see, tourism Spain is big business! However, it is vital that tourism here is managed effectively to ensure that sustainable tourism principles are adopted.
If you enjoyed this article about tourism in Spain, I am sure you will love these too:
- Almeria Spain- 15 fascinating things you should know
- Spain’s islands- 15 fascinating facts
- 35 spectacular things Spain is known for
- 50 Famous Landmarks in Spain (with photos)
- Bullfighting in Spain: What you NEED to know
Liked this article? Click to share!

- Shop to Support Independent Journalism
- We Have Issues
- Investigations
- Ethics Policy
- Ad-Free Login
'Go home': Overtourism sparks backlash in Spain
Agence france-presse.

Anti-tourism movements are multiplying in Spain, the world's second most visited country, prompting authorities to try and reconcile the interests of locals and the lucrative sector.
Rallying under the slogan "The Canaries have a limit", a collective of groups on the archipelago off northwest Africa are planning a slew of protests on Saturday.
The Canaries are known for volcanic landscapes and year-round sunshine and attracts millions of visitors from all over the world.
Groups there want authorities to halt work on two new hotels on Tenerife, the largest and most developed of the archipelago's seven islands.
They are also demanding that locals be given a greater say in the face of what they consider uncontrolled development which is harming the environment.
Several members of the collective "Canaries Sold Out" also began an "indefinite" hunger strike last week to put pressure of the authorities.
"Our islands are a treasure that must be defended," the collective said.
The Canaries received 16 million visitors last year, more than seven times its population of around 2.2 million people.
This is an unsustainable level given the archipelago's limited resources, Victor Martin, a spokesman for the collective told a recent press briefing, calling it a "suicidal growth model".
- 'Go home' -
Similar anti-tourism movements have sprung up elsewhere in Spain and are active on social media.
In the southern port of Malaga on the Costa del Sol, a centre of Spain's decades-old "soy y playa" or "sun and beach" tourism model, stickers with unfriendly slogans such as "This used to be my home" and "Go home" have appeared on the walls fn doors of tourist accommodations.
In Barcelona and the Balearic Islands, activists have put up fake signs at the entrances to some popular beaches warning in English of the risk of "falling rocks" or "dangerous jellyfish".
Locals complain a rise in listings of accommodation on short-term rental platforms such as Airbnb have worsened a housing shortage and caused rents to soar, especially in town centers.
The influx of tourists also adds to noise and environmental pollution and taxes resources such as water, they add.
In the northeastern region of Catalonia, which declared a drought emergency in February, anger is growing over the pressure exerted on depleted water reserves by hotels on the Costa Brava.
"There are tourist destinations that are at the limits of their capacity," said Jose Luis Zoreda, the vice president of tourism association Exceltur .
"It's a problem that appears occasionally in the high season and in certain parts of the country, but it's getting worse".
- Loudspeaker ban -
Before the Covid-19 pandemic brought the global travel industry to its knees in 2020, protest movements against overtourism had already emerged in Spain, especially in Barcelona.
Now that pandemic travel restrictions have been lifted, tourism is back with a vengeance -- Spain welcomed a record 85.1 million foreign visitors last year.
In response, several cities have taken measures to try to limit overcrowding.
The northern seaside city of San Sebastian last month limited the size of tourist groups in the centre to 25 people and banned the use of loudspeakers during guided tours.
The southern city of Seville is mulling charging non-residents a fee to enter its landmark Plaza de Espana while Barcelona had removed a bus route popular with tourists from Google Maps to try to make more room for locals.
Housing Minister Isabel Rodriguez said over the weekend that "action needs to be taken to limit the number of tourist flats" but stressed the government is "aware of the importance of the tourist sector", which accounts for 12.8 percent of Spain's Gross Domestic Product.
Stories Chosen For You
Should trump be allowed to run for office, dem lawmaker uses world map adorned with racist comments to illustrate trump hatred.
Rep. Robert Garcia (D-CA) on Tuesday pulled out a world map as a prop to illustrate the lengthy history of racist comments made by former President Donald Trump .
During a hearing to discuss the 2025 budget request for the Department of Homeland Security, Garcia took apart Trump's recent remarks about wanting to welcome immigrants from "nice" countries like Denmark, Switzerland or Norway, which are overwhelmingly white.
"We know that in 2016, Donald Trump launched his campaign by pointing out that Mexicans are essentially rapists and murderers, we've seen that already," he said.
"In 2018, he told members of Congress in the Oval Office, when they discussed protecting immigrants from African countries, that he didn't want any migrants from what he called 's--t hole countries,' and that's his quote, not mine."
Garcia contrasted this with how Trump talks about European nations being "nice" and about how Trump once proposed a total ban on travelers from Muslim-majority countries from entering the United States.
ALSO READ: Republican dodges when asked if ousting Speaker Johnson makes his party look strong
To illustrate this point, an aide for Garcia held up a map that had the words "murderers and rapists" written over Latin America, "s--t hole countries" written over Africa, "banned" written over the Middle East and "nice immigrants" written over Europe.
These quotes are just part of a documented history of racist rhetoric by Trump.
In 2017, Trump said that some of the people who attended the neo-Nazi "Unite the Right" rally in Charlottesville were " very fine people ," and in 2019 he told four Democratic congresswomen of color to " go back " to their home countries, even though all of them are American citizens and three of them were born in the United States.
Trump also rose to prominence in American politics by pushing the racist "birther" conspiracy theory that former President Barack Obama was ineligible to be president based on false claims about him being born in Kenya.
Watch the video below or at this link.
Pro-Trump news network settles election fraud defamation claim with Smartmatic
According to an announcement from an attorney for One American News Network (OANN), the right-wing news outlet has settled a defamation suit brought by the voting tech giant Smartmatic over false claims about rigged voting machines in the 2020 election.
OANN attorney Chip Babcock told CNN that the suit, "Has been resolved pursuant to a confidential agreement."
Also releasing a statement was Smartmatic’s lead attorney Erik Connolly, who said the company, "Has resolved its litigation against OANN through a confidential settlement."
As CNN pointed out, both parties were mum on the specific details of the settlement.
Also read: Rudy Giuliani lobs apparent racist dog whistle at Colombian-born hush money judge
Smartmatic's suit against OANN was part of a string of lawsuits filed against right-wing networks and personalities that pushed claims about mass voter fraud in 2020. The suit was filed in 2021 and alleged OAN “victimized” the company by spreading lies about voter fraud to “increase viewership and revenue.”
Smartmatic has additional lawsuits pending that target Fox News and Newsmax. According to CNN, OANN is the "most extreme" of the conservative-leaning networks that broadcasted false claims about 2020.
"The channel worked closely with Russian operatives on a propaganda-style documentary during Trump’s first impeachment in 2019 over allegations he pressured Ukraine to investigate his political rivals," CNN's report stated. "One of its correspondents, who is also an attorney, even worked with Trump’s legal team to subvert the 2020 election results."
OANN has also fallen under controversy for pushing false claims about the COVID-19 pandemic and the mandates that came along with it.
In July of 2022, the OANN was dropped by Verizon. The network still faces similar litigation from voting tech company Dominion Voting Systems.
As Deadline reported , Smartmatic provided voting technology to Los Angeles in 2020, but not anywhere else in the country.
'She's cuckoo pants': Attorneys mock Trump lawyer for 'due process' remark
Alina Habba, one of former President Donald Trump's New York-based attorneys, is getting roasted by lawyers and legal experts over her latest remarks on Fox News alleging her client isn't being afforded due process.
In a nutshell, "due process" is the legal term for the set of rights afforded to criminal and civil defendants mentioned in the 14th Amendment to the U.S. Constitution. This includes everything from the right to question witnesses, screen jurors, be presumed innocent until proven guilty and be granted a fair and impartial ruling, among others.
In a recent interview with Fox News' Sean Hannity , Habba alleged that Judge Juan Merchan was depriving her client of those rights by refusing to let him attend oral arguments in the Supreme Court of the United States' chambers next week.
"Not even allowing a person due process, the right to go sit in front of the Supreme Court and hear a case that determines many lawsuits that are currently against President Trump on immunity, on grounds for immunity," she said.
READ MORE: 'Bogus motion by the Trump team': Legal experts mock Habba's latest filing
In a criminal proceeding, a defendant's attendance is almost always required except in extraordinary circumstances, whereas a petitioner's attendance during SCOTUS oral arguments is not.
Legal experts reacting to Habba's remarks on social media doubted her knowledge of basic law concepts.
"One would hope a lawyer would know that due process does not include attending an oral argument at the United States Supreme Court," Georgia-based law professor Anthony Michael Kreis tweeted .
Dianne Callahan, who is a student at Emory University Law School, echoed that sentiment, tweeting that she was "having second thoughts about this woman being an actual attorney."
"[Habba] should reread the 14th Amendment Due Process Clause," Callahan wrote. "Trump is not being deprived of a protected life, liberty, or property interest."
READ MORE: 'Your client is a criminal defendant': Judge denies Trump request to skip trial for SCOTUS
Progressive influencer Ron Filipkowski — who is also a former federal and state prosecutor — quote-tweeted the video and told his followers, "That is not what due process means. Are we sure she went to law school? That's taught like week one."
"Watching an oral argument isn’t due process," attorney Shane Etheridge posted . "They just throw words out and hope somebody is dumb enough to accept it as being a correct statement."
Democratic strategist Adam Parkhomenko tweeted the clip of Habba's interview and asked "legal scholars" among his followers to "explain this to me." This prompted attorney Bradley Moss to tweet a GIF of actor John McGinley's Scrubs character, Dr. Perry Cox, saying, " She's cuckoo pants. "
When contacted by Newsweek, Habba defended her comments , saying," Having the right to attend Court proceedings when you are a defendant in cases which hinge on such a critical decision such as immunity is a right no one should be deprived of."

Republican dodges when asked if ousting Speaker Johnson makes his party look strong
Asking our youth to save us from ourselves just isn't fair, why has america tolerated 6 illegitimate republican presidents.
Copyright © 2024 Raw Story Media, Inc. PO Box 21050, Washington, D.C. 20009 | Masthead | Privacy Policy | Manage Preferences | Debug Logs For corrections contact [email protected] , for support contact [email protected] .

An official website of the United States government
The .gov means it’s official. Federal government websites often end in .gov or .mil. Before sharing sensitive information, make sure you’re on a federal government site.
The site is secure. The https:// ensures that you are connecting to the official website and that any information you provide is encrypted and transmitted securely.
- Publications
- Account settings
Preview improvements coming to the PMC website in October 2024. Learn More or Try it out now .
- Advanced Search
- Journal List
- Elsevier - PMC COVID-19 Collection
- PMC10008094
Carbon footprint of tourism in Spain: Covid-19 impact and a look forward to recovery
Associated data.
- Data will be made available on request.
Tourism is very vulnerable to climate change and the disruption of Covid-19, facing two challenges: fighting climate change pursuing its carbon emissions goals, and recovering from the complex pandemic effects. We contribute to the incomplete understanding of tourism emissions pandemic impact and in different post-covid recovery scenarios. Using official data on tourists' consumption, we calculate the carbon footprint of tourism in Spain in 2019 and 2020 under different recovery pathways, including changes in consumption patterns and emissions efficiency, using a multiregional input-output model. Results show that the carbon footprint of tourism in Spain fell by 63% in 2020 compared to pre-pandemic levels, which would be aligned with the current sectoral decarbonisation target. However, the new tourists’ consumption patterns resulting from the pandemic are insufficient to increase tourism sustainability if they imply pre-pandemic consumption levels. The results provide empirical ground for the binary debate on “recovery or reform”.
1. Introduction
Tourism is a driving force for prosperity and development worldwide ( Castro-Nuño et al., 2013 ). Tourism activities sustain jobs and businesses as well as provide value to natural and cultural heritage. The direct contribution of tourism to Gross Domestic Product (GDP) ranges from around 2% to over 10% ( UNWTO, 2019 ), and it was 10.4% globally in 2019 ( WTTC, 2021b ). Spain is in the upper limit of this range as tourism directly accounted for 12.4% of GDP and 12.7% of total employment in 2019. However, these positive outcomes are threatened because tourism is also a very vulnerable activity to climate change and disruptions, such as the Covid-19 outbreak. This context leads to two crucial challenges for the future of tourism: to recover from the pre-pandemic impact while, at the same time, reducing carbon emissions and increasing their sustainability and resilience against climate change and other external shocks. Consequently, tourism cannot return to pre-Covid-19 normal, but it needs to respond with new strategies taking advantage of the lessons learned from the pandemic crisis. This paper contributes to those challenges providing evidence of the carbon footprint changes before and after the pandemic and under different recovery scenarios that gather changes in tourist behaviour and policies.
Regarding climate change, tourism is, at the same time, a heavy contributor to it. Recent studies find it responsible for about 8% of global greenhouse gas (GHG) emissions in 2013 ( Lenzen et al., 2018 ), a figure that can almost double in typical tourism destination countries like Spain ( Cadarso et al., 2015 , 2021 ; Sun et al., 2022 ; Tian et al., 2021 ). The tourism industry acknowledges the need to fight against climate change. The World Travel and Tourism Council (WTTC) and the United Nations World Tourism Organization (UNWTO) set emissions mitigation goals consistent with the ambition of the Paris Agreement ( Scott et al., 2016 ; WTTC, 2009 ). However, tourism emissions have significantly increased globally, despite achieving emissions-intensities reductions ( Gössling and Peeters, 2015 ; Lenzen et al., 2018 ), and forecasts point to further increases ( WTTC, 2021a ), even considering efficiency improvements ( Gössling and Peeters, 2015 ).
The Glasgow Declaration, launched at the COP26 United Nations Climate Change Conference, should be a turning point. It proposes a coordinated plan for tourism to support the global commitment to halve emissions by 2030 and achieve net zero by 2050 ( UN, 2021 ). Consequently, a debate has begun since this needs to be translated into specific changes in the economic system, consumer behaviour and policies such as, for example, those proposed by the International Energy Agency for the global economy ( IEA, 2021 ). Some of those would significantly impact the tourism industry, like radical shifts in modes of transport, investment into technological advances in renewable energies, energy efficiency, and sustainable fuels, increases in carbon prices, and changes in consumer behaviour ( Scott and Gössling, 2022 ). However, the size and impact of these shifts remain incompletely understood, and our research intends to contribute to this measurement.
In this context of climate change fighting, the pandemic disruption arises, revealing tourism as highly vulnerable to it and the breakdown of global value chains ( Gössling and Peeters, 2015 ; Gössling et al., 2021 ). Although the Covid-19 pandemic has severely impacted all the economies and sectors worldwide, tourism has been one of the most stressed areas. The imposed confinement measures, the shutting of non-essential activities, the closure of borders, and the breakdown of global value chains, restricted tourism to the point when it even ceased altogether for some months ( Gössling et al., 2021 ). According to the UNWTO, the economic consequences are about eleven times higher than those experienced in the 2008 crisis and bring tourism back to 1990 levels ( UNWTO, 2021 ), and led tourism global contribution to GDP to fall to 5.5% in 2020 ( WTTC, 2021b ). In Spain, Covid-19 caused a decrease of 77% in arrivals in 2020, resulting in almost seven percentual points lower contribution to GDP ( INE, 2022d ). The medium and longer-term effects of the pandemic are still far from being clear, as well as their implications on tourism sustainability. So then, the present paper aims to enrich our understanding of the environmental consequences of Covid-19 and the post-pandemic recovery of tourism in Spain.
There is already a relevant number of studies analysing the impact of the Covid-19 pandemic on tourism, as attested by three reviews of the literature that provide a good picture and key insights ( Gössling and Schweiggart, 2022 ; Yang et al., 2021 ; Zopiatis et al., 2021 ), with the first one even considering the relevance of the contributions for the management of climate change. This literature shows, nevertheless, some research gaps that our research aims to contribute. Firstly, these studies focus mainly on tourism economic impacts of Covid-19, with little attention being paid to environmental issues. To mention only those regarding the Spanish economy, on the one hand, Cardenete et al. (2022) assess the economic consequences on tourism in the Spanish region of Andalusia, using two scenarios of estimated fall in tourism demand. On the other hand, Rodousakis and Soklis (2022) , whose estimations are based on the first aggregate data available on international travel receipts, conclude that the impact is going to be higher for Spain than for Germany, while Vena-Oya et al. (2022) forecast that the probability of a pandemic impact worse than the 2008 crisis is high using fuzzy cognitive maps. Therefore, "sustainability and transformation" is one of the areas where further research is needed ( Zopiatis et al., 2021 ). More specifically, rigorous environmental valuation analysis through environmental impact models (such as carbon footprint analysis) is recommended to evaluate better the pandemic's environmental effects on the tourism system ( Yang et al., 2021 ).
Secondly, various methodologies have been applied to estimate those impacts, at different spatial levels, from countries to regions or cities. In some cases, the methods are criticised for being primarily descriptive ( Gössling and Schweiggart, 2022 ; Yang et al., 2021 ), and the data used is based on estimations, early available data (as in the examples of the Spanish case), authors-elaborated interviews and, often, many tourists' behaviour indicators rely on measures of intention ( Yang et al., 2021 ). All these features may limit the significance of the results. We overcome these drawbacks by calculating the tourism carbon footprint using a multiregional input-output model (MRIO) that allows including all direct and indirect emissions along the global value chains (GVC), linking the supply of tourism services to satisfy tourists' demand in one country to the CO 2 emissions wherever they are generated ( Cadarso et al., 2022 ). This feature of MRIO footprint is crucial in the assessment of the pandemic disruption impact. When focusing on tourism, MRIO model is combined with Tourist Satellite Accounts (TSA) data. TSA are the most appropriate source of tourism demand data as they can be better used within the footprint analysis ( Sun et al., 2020 ), but they take some time to be produced and published. This means earlier studies on the topic have not been able to apply this methodology. Our analysis uses the newly published data on tourism consumption in Spain from the TSA that provides official data for 2020 ( INE, 2022d ), avoiding estimations in calculating the pandemic impact.
Finally, Yang et al. (2021) recognise that little insight into future scenarios has been provided. Previous studies are less focused on the post-pandemic situation and paths for recovery, their impact, and how they would affect carbon emissions and tourism environmental goals. Regarding the post-Covid times, the main topics for the so-called "new normal" have been: the health and sanitary measures to reduce outbreak risk, the fiscal measures to support the tourism business ( Kuo, 2021 ; Villacé-Molinero et al., 2021 ), the need to increase resilience in global value chains ( Deb and Ahmed, 2022 ; Tasnim et al., 2022 ), and employees' engagement and satisfaction ( Shehawy and Abouzied, 2022 ). Moreover, they focus on growth or business-as-usual strategies, as indicated by Sigala (2020) , leaving the environmental issues aside or in the periphery ( Hall et al., 2020 ; Khan et al., 2021 ; Mkono et al., 2022 ). As an example of this peripheral consideration, Vu et al. (2022) mentioned the possibility of developing post-covid tourism toward green growth as one strategy out of eight to attract tourists more interested in low-carbon destinations after Covid-19. In addition, there is little attempt to measure the environmental impact of those strategies. Our research covers the lack of analysis regarding the effect of the recovery trends on the environment measuring the tourism carbon footprint in Spain. Gössling and Schweiggart (2022) is one of the few papers devoted to analysing the implications of the net-zero goal for tourism using the 2050 global roadmap of the IEA. However, they only empirically estimate the different risks countries experience in their transition to a net-zero future using four indicators (percentage of electricity supply from fossil fuels, average distance to a top five destination, size of outbound international market, and food import dependency). The research by Sun et al. (2022) is another exception as they evaluate Norway's net-zero emissions goal, assuming tourism returns to its pre-pandemic average growth, using a single region input-output model.
Our analysis goes beyond the contributions of Scott and Gössling (2022) and Sun et al. (2022) because we use a MRIO, first, for calculating the carbon footprint of tourism in Spain in 2019 (pre-pandemic) and 2020 (pandemic) and, second, developing some scenarios to assess possible new trends of recovery and their carbon footprint impact and their sustainability in the new normal (post-pandemic). Moreover, we build two types of scenarios. On the one side, some scenarios capture new tourist consumption patterns. The Covid-19 pandemic not only implied those losses in the amounts of visitors and their consumption but also shifts in tourist behavior and consumption patterns (lower international tourists, more outdoor activities, …). Some of these changes are forecasted to be temporary or short-term. Still, others are expected to persist in the medium term ( Marques Santos et al., 2020 ), adding uncertainty to the recovery phase. On the other side, we build policy scenarios to assess the impact of the measures included in two of the priority lines of the Spanish Government Recovery, Transformation, and Resilience Plans (PRTR), that is, the green and sustainable transition and energy efficiency improvements ( Gobierno de España, 2021 ) making use of the roadmaps of the IEA.
The Covid-19 crisis is also increasingly seen as an opportunity to develop a more sustainable and resilient tourism sector ( OECD, 2020 ). Several policy measures promoted by the European Union and State members are oriented to foster these goals, as the ones considered in the scenarios built, as commented before. As a combination of all these circumstances, the tourism sector will be different in the so-called "new normal" after Covid-19. Our results confirm the expected significant decrease of 62% in the carbon footprint along with the fall of tourist visitors and how tourism has been more affected than other economic activities reducing its share in the Spanish total carbon footprint from 14,5% in 2019 to 5%. Results from the scenarios provide empirical support for those who claim that a pro-growth agenda or a back-to-normal prospect, improving existing models and implementing measures to transform the production system into a low-carbon one ( Prideaux et al., 2020 ), can be insufficient, requiring a systemic shift in the global tourism economy instead ( Gössling and Schweiggart, 2022 ; Sigala, 2020 ). The results will help assess the potential of tourism to contribute to the Paris Agreement and Sustainable Development Goals, becoming a low-carbon sector.
2. Material and methods
2.1. the environmentally extended multiregional input-output model.
Input-output analysis (IOA) is a widespread methodology to assess the impacts of economic activities, especially in the environmental sphere (Hoekstra, 2010). Multi-regional input-output (MRIO) models describe the structure of the economy as a network between industries in different regions in which the final demand for goods or services from one industry is the trigger that leads to worldwide impacts in other economic sectors and countries.
Environmentally extended MRIO models ( Davis and Caldeira, 2010 ; Minx et al., 2009 ; Peters, 2008 ) are the prevailing method to analyse the direct and indirect environmental impacts generated by economic activities along global value chains. These impacts can be different when considering, for instance, emissions ( Lenzen et al., 2018 ; Minx et al., 2009 ), materials ( Lenzen et al., 2022 ; Wiedmann et al., 2015 ), water ( Cazcarro et al., 2014 ), land ( Dorninger et al., 2021 ) or energy ( Lee et al., 2021 ). Following Miller and Blair (2022) , the environmental extension of the MRIO model with n countries and m industries is defined by Eq. (1) :
where A is the matrix of technical coefficients; I is the identity matrix and ( I − A ) − 1 is the Leontief inverse, for which each column provides the direct and indirect requirements per unit of finished production intended for final demand. y ^ is a matrix of final demand diagonalised by blocks, where each block contains a m -element diagonalised vector y ^ p q that represents the production of every industry in country p that is consumed by country q final demand. e ^ is a diagonal matrix containing the environmental impact per unit of production. In this study, e ^ corresponds to the emissions coefficients, i.e. GHG emissions per unit of output. Therefore, the resulting matrix F gives the direct and indirect GHG emissions generated worldwide in all the production stages required to meet the final demand represented by y ^ . A lecture by rows shows the producer-based accounting (PBA), i.e. the industries and regions that directly release the emissions. Reading by columns provides the consumer-based accounting (CBA) or footprint, which reveals the industries and regions whose final demand embodies those emissions.
Input-output analysis presents some general limitations, such as the assumption of homogeneity between firms inside the same industry, which can be a strong constraint when working with broad sectors; the consideration of fixed proportions between inputs and output, which ignores economies of scale; the assumption of constant prices and the absence of capacity constraints ( Miller and Blair, 2022 ). Other uncertainties are related to the data sources and coefficient variations. In this sense, we have performed a sensitivity test of the model by using Monte Carlo analysis, which can be found in the supplementary information (SI.Section 3).
Despite these limitations, the features of input-output analysis make it an adequate and versatile tool for assessing the impacts generated by tourist activities. Given the current spread and fragmentation of global value chains, a consumption pattern apparently localised in a region -like the expenditure linked to touristic activities- can lead to worldwide impacts in a range of industries. Therefore, the capacity of environmentally-extended input-output models to reveal direct and indirect impacts in a variety of regions and industries, and their feature of taking tourists’ expenditure as the driver of these effects, make them an adequate tool to determine the environmental impacts of touristic activities ( Sun et al., 2019 ; Zha et al., 2021 ).
The characteristics of tourism as an economic activity involving consumers from different origins moving across borders make it complex to define the boundaries for footprint calculations. Sun et al. (2020) find three main perspectives to define tourism carbon inventories: production, consumption, and destination, being the last one specific to tourism accounting. In this work, we rely on a destination perspective by using the Tourism Satellite Account Principle, which measures the domestic and foreign emissions produced to support all touristic activities within the geographic territory of an economy ( Sun et al., 2019 ). Under this approach, the final demand of the MRIO model is built from a tourism satellite account (TSA), which specifies the total expenditure which occurs in a destination, in order to calculate the worldwide emissions (domestic or international) generated directly or indirectly to satisfy the tourism consumption in this destination ( Sun et al., 2020 ). Several studies use a similar approach, such as Lenzen et al. (2018) , which quantifies the tourism-related global carbon flows between 160 countries and their carbon footprints under both origin and destination accounting perspectives. Additional examples of the analysis of tourism carbon footprints through input-output modelling are those performed by Cadarso et al. (2015) , (2016) for Spain, Sun (2014) for Taiwan, Kitamura et al. (2020) for Japan, and Zha et al. (2021) for China.
In operational terms, the assessment of the carbon footprint of the touristic activities taking place in the Spanish territory implies that the final demand matrix ( y ^ ) included in our model only contains non-zero values for the columns involving Spain. The corresponding rows show the origin country and industry that provide the finished products. Thus, for q = { S p a i n } , the diagonalised vectors y ^ p q include data on finished products from country p consumed by tourists in Spain. Otherwise, for q ≠ { S p a i n } , all the elements in y ^ p q are zero. Expression (2) shows a simplified structure for the model variables assuming that Spain is located in position 1 in the input-output table. Notice that each of the sub-matrixes F p 1 , e ^ p , L p q a n d y ^ p 1 represented in Eq. (2) contains m industries for each region, which means that each of the submatrices’ dimension is m x m .
where the resulting matrix F t S P A contains the direct and indirect emissions released all over the world to produce the goods and services consumed by tourists in Spain, distinguishing the emitting industries and regions (PBA) and the finished products that embody those emissions and are ultimately consumed by tourists in Spain (CBA).
2.2. Data sources and data preparation: MRIO database and tourism satellite accounts
The MRIO model applied here relies on the input-output table and emissions satellite accounts provided by Exiobase in its 3.8 version ( Stadler et al., 2018 ) for 2019 and 2020. This database provides details for 49 regions (44 countries and 5 rest of the world regions) and 163 industries. We will, however, aggregate our MRIO model into 59 main sectors instead, as detailed in the following paragraphs. Regarding the Exiobase environmental satellite account, it contains data on industry-specific air emissions for 27 pollutants. To obtain the stressor employed to account for GHG emissions, we have added the emissions of the three top greenhouse gases from combustion (CO 2 , CH 4 , N 2 0) after transforming each of them into CO 2 equivalent units for each industry using their global warming potential (GWP) over a 100-year period ( IPCC, 2013 ). 1 Further details about the emissions satellite accounts from Exiobase can be found in SI.Section 2.
The assessment of the carbon footprint for tourism in Spain requires introducing in the model the final consumption linked to tourism within the Spanish territory – both resident and non-resident – as a final demand matrix. We have used the interior touristic consumption data in Spain in 2019 and 2020, retrieved from the National Tourism Satellite Account (TSA) ( INE, 2022d ). According to the TSA definition, interior touristic consumption refers to the money spent on any tourism activity taking place in the territory, including services linked to own-account holiday accommodation, regardless of the origin of the tourists. Following the principles of the System of National Accounts (SNA), the TSA also includes some spending by outbound tourists when it takes place inside Spain and is provided by domestic suppliers. Therefore, interior touristic consumption is the addition of the internal tourism expenditure–domestic tourist expenditure made by residents in the territory –, the receiving tourism expenditure– made by residents in a different territory –, and other components of tourist consumption such as in-kind tourist social transfers and other imputed consumption. The TSA provides this indicator disaggregated into 11 tourism characteristic products plus a general category of other non-characteristic products.
Before implementing the model, it is necessary to develop several transformations on the TSA data for 2019 and 2020 to convert each of these sets into a final demand matrix suitable to be introduced in the MRIO model. Following the proposal detailed in Cadarso et al. (2022) , we have applied the following steps. We have started by translating the 2020 expenditure into 2019 prices using deflators from INE (2022a) to enable comparisons between the footprints of both years without the effect of prices. After that, the category of non-tourism-characteristic products was split into the products reported in the Spanish national accounts –110 products minus 11 considered tourism-characteristic products –. This allocation was made following the product consumption pattern of the Spanish households extracted from the use table in the Spanish national accounts (NA) ( INE, 2022 g ), reducing the weight of certain products rarely consumed by tourists (for instance, chemical products or concrete) and increasing the share of those more demanded in touristic activities (for example, vessels). Each tourism-characteristic product was allocated into its corresponding category in the national accounts’ product structure.
The Exiobase input-output tables (IOT) are expressed in basic prices ( Stadler et al., 2018 ), so the next step was to convert the touristic consumption from purchaser prices into basic prices. We have followed the procedure detailed in Gueddari-Aourir et al. (2022) and García-Alaminos et al. (2022) , using the margins and taxes percentages calculated for each product from the supply table in the Spanish NA ( INE, 2022f ). Once these percentages are calculated, we have removed taxes from the purchaser prices. After that, we have detracted transport and trade margins and reassigned them to the specific products that provide these auxiliary services not included in the basic price of the product (in the case of transport margins, more than 90% of them are reallocated into “inland transport services different from railroad”; and in the case of trade margins, they are split almost equally between wholesale and retail trade services). This process results in a vector of interior touristic consumption expressed in basic prices and disaggregated into 110 products for each of 2019 and 2020.
Considering that we are working with the industry by industry Exiobase IOT, a homogenisation process is required. First, we must transform the vector from products to industries, using model D ( Mahajan et al., 2018 ), which implies keeping technology constant by product. We use data from the supply table in the Spanish NA ( INE, 2022f ), in which we divide each element by the row sum, and we multiply the transpose of the resulting matrix by our vector of tourism consumption. This method allows reallocating the consumption of each product to the corresponding industries where they are fabricated, as some of those industries are the source of more than one type of good or service. In this way, we have moved from 110 products to the 81 industries covered by the NA. Second, we must harmonise the sectoral detail for the two databases employed, so we have converted the 163 Exiobase industries and the 81 NA industries into 59 sectors (see Tables SI.1 and SI.2 for more information about this aggregation process).
After this process, we achieved a vector of interior touristic consumption expressed in basic prices and disaggregated into 59 industries for each year. However, this vector lacks detail on the geographical origin of the goods and services demanded from each industry by tourists in Spain, except for the tourism-characteristic activities, which can be assumed to be fully provided by the corresponding Spanish industries given the characteristics of touristic services. Therefore, it is essential to distribute the expenditure in non-tourism-characteristics industries among the 49 regions (including Spain) that may act as suppliers in our MRIO model. Given the data limitations in the TSA, we have applied this distribution to the 49 Exiobase regions according to the import structure of the Spanish households' final demand provided by this database for 2019 ( Stadler et al., 2018 ). In this way, we obtain a vector of 2891 elements (59 industries x 49 regions) suitable to be diagonalised by blocks as exposed in Expression (2).
As mentioned before, the model is run for 49 regions and 59 industries. However, results are presented aggregated into 10 regions (Spain, Germany, France, United Kingdom, Italy, Rest of Europe, China, United States, BRIIAT – which contains Brazil, Russia, India, Indonesia, Turkey, and Australia – and Rest of the World) and 14 sectors (Agriculture and mining; Manufactures; Electricity, water, gas and waste; Construction; Wholesale trade; Retail trade; Land transport; Air transport; Other transport; Accommodation and food services activities; Professional services; Real state and rental activities; Leisure; and Other activities). The calculations are performed for three vectors of final demand (that add up to the total interior touristic consumption): resident tourists’ expenditures, non-resident tourists’ expenditures, and other components of touristic consumption (mainly imputed rents of owner-occupied dwellings).
2.3. Scenario setting
Our aims go beyond assessing the short-term effects of Covid-19 on the environmental impact of tourism in Spain. What can this extreme event tell us about the future trends in tourism? Can any of those changes reduce the total carbon footprint of tourism in a significant way? To shed some light on these questions, we will present potential scenarios based on the most recent data on tourism behaviour and spending in Spain.
The configuration of the new normal is highly uncertain for every industry, as well as for the tourism sector. The uncertainty linked to the pandemic recovery has been recently increased by the Russia-Ukraine war, mostly in Europe, and by the increasing inflation with unclear outcomes. Previous studies that estimated the impact of terrorism, corruption, and economic policy suggested that their monetary impact on tourism could vary as much as a 14% increase with scenarios of minimum insecurity to a decrease of around 17% in the opposite case ( Manrique-de-Lara-Peñate et al., 2022 ), and, besides, the pandemic has seemed to change people's perception about public health risks derived from tourism ( Qiu et al., 2020 ). In addition to this uncertain context, tourism is also committed to the fight against climate change, bringing further changes to the sector.
To deal with that uncertainty, we build several scenarios to assess possible new trends of partial and total recovery of tourism and their carbon footprint impact (post-pandemic), as summarised in Table 1 . The scenario-building process takes the Spanish TSA data for 2019 and 2020 as a starting point ( INE, 2022d ), implementing modifications both in the relative and absolute magnitude of the expenditure items and in the domestic-receiving composition of the tourist interior expenditure. We employ different assumptions and trends identified from additional sources, which are exposed in this section.
Scenarios overview.
Source: own elaboration
All seven designed scenarios deal with changes in consumption patterns, while only one (the last one) estimates the impact of an increase in energy efficiency. Two scenarios assume a partial recovery (that is, the tourism consumption level is the actual level of 2021), while the other five assume a total recovery (that is, the consumption level is that of 2019, the pre-pandemic level). In doing so, we aim to obtain an estimate of the evolution of the carbon footprint in 2021 and beyond. We explain each scenario in more detail as follows, and the details on the touristic interior consumption for each is shown in Tables SI.6, SI.7, and SI.8.
One of the observed trends in tourism worldwide is concerned with the different behaviour of resident and international tourism. International tourism experienced a higher breakdown than domestic tourism in accordance with the strictest and most prolonged restrictions on mobility between countries. Besides, the tourism recovery is being headed up by domestic tourism since international tourists are waiting to see good pandemic results, vaccines, and treatments before regularly returning to normal, with expected growth in international spending only starting in 2022 ( WTTC and Trip.com Group, 2021 ). This led to an expected 38% lower level of international tourists postCovid-19 in Spain (being the highest decrease in Europe and the third worldwide ( Marques Santos et al., 2020 ). In Spain, the drop in non-resident tourist expenditure was 73.9% compared to 47.2% for residents in 2020, resulting in a reversed share of resident and inbound tourism expenditure in total expenditure (from a split 39–61% domestic vs. inbound tourism, quite stable in the previous years, to 57–43% in 2020 ( INE, 2022d )).
This evolution is the basis for the first proposed scenario, scenario 1 , which points to the analysis of the tourism carbon footprint if the Staycations (generally understood as vacations in the home country ( WTTC and Trip.com Group, 2021 ) trend continues over time. This scenario takes into consideration the different expenditure distribution of residents and international tourists and calculates emissions considering the novelty of an increased weight of resident tourism that recovers faster than the international one. This higher weight of domestic destinations and activities implies spending increases in Food services and Travel agencies, and reductions in Accommodation, Leisure, Cultural services, and non-tourism-characteristic products.
The Covid-19 pandemic has also caused changes in tourist consumption patterns that are expected to persist in the medium term. These changes are a combination of a number of trends, such as an increased preference for destinations with low tourist density, away from big cities, with more outdoor activities and contact with nature, use of private vehicles ( Marques Santos et al., 2020 ), or a reduction in business travels and an increase in wellness tourism, destinations where people can spend more time and money on self-care, wellness, and stress relief ( WTTC and Trip.com Group, 2021 ). Scenario 2 takes into consideration the mentioned trends in tourism patterns and the actual real increase in tourism expenditure experienced in 2021 with respect to 2020, that is a partial recovery of 50.4% for resident tourists (according to the Survey of Resident Tourism ( INE, 2022h ) and 72.2% for non-resident tourists (following EGATUR data ( INE, 2022b ). It considers that the changes in tourism consumption patterns caused by the pandemic remain both in the behaviour of domestic and foreign tourists. Consequently, scenario 2 aims to estimate the Spanish tourism carbon footprint in 2021 if the changes in tourists’ distribution of spending due to the pandemic are applied to the partial recovery levels.
However, what if those “pandemic” consumption patterns returned to normal, that is the pre-pandemic ones? This is considered in scenario 3. Scenario 3 includes the same rate of growth of tourism consumption as scenario 2 (the actual increase of tourism consumption experienced in 2021 regarding 2020) but, in this one, the partial recovery implies that tourists go back to the pre-pandemic behaviour and patterns of consumption (those of the year 2019).
Both scenarios 2 and 3 account for a partial recovery (the one recorded by 2021 data) . However, a total recovery is expected around 2023 or even sooner. For instance, provisional data of international tourist expenditure in Spain shows that in May 2022 (the last month available at the time of writing) was only 1% lower than the pre-Covid-19 one (May 2019) ( INE, 2022b ). The following scenarios, then, include a total recovery, meaning that the level of tourism consumption goes up to pre-pandemic times, that of 2019. Scenario 4 considers a total recovery and replicates the pandemic tourism consumption pattern, under the assumption that the changes induced by the pandemic are medium-long term. As a result, scenario 4 shares with scenario 2 the consumption pattern while it differs in the level of consumption .
Scenario 5 evaluates the observed new trend in Spanish tourism, for both domestic and foreign tourists, of more sun-and-beach tourism, as a reflection of an increased general preference for outdoor activities, as well as destinations away from big cities and overcrowded places. For resident tourists, the share of sun-and-beach over all motivations for tourism increased from 21.1% in 2019 to 26.4% in 2021 ( INE, 2022b ), while for inbound tourists it grew from 29.3 to 43.4% ( INE, 2022b ). Conversely, there was a reduction in cultural tourism. This type of tourism (sun and beach) implies a different consumption pattern than other tourism motivations, for instance, a higher share of Accommodation and food services and a lower share of Travel agencies, Leisure and Cultural services, and Transport than other types of tourism (as shown by microdata from INE (2022h) .
Scenario 6 deals with the need for tourism to address its high carbon footprint, and it, therefore, proposes a radical change in the pattern of consumption, shifting part of the expenditure from air transport to rail transport as a more sustainable-low carbon travel mode. This change would follow the French proposal of banning the short continental flights that can be covered by train in less than 2.5 h, as part of the French package directed to cut emissions by 40% by 2030 ( Reuters, 2021 ). This can be considered the first law that results from the flygskam ("flight shame") trend, born in Sweden, that encourages people to stop flying and use lower-emission travel modes like train instead ( Chiambaretto et al., 2021 ). To make this scenario more feasible, we substitute air by railway expenditure for international tourists arriving from nearby countries (France and Portugal). Tourists from these two origins accounted in 2019 for 6.5% of total foreign tourists traveling to Spain by flight ( INE, 2022i ). We also substitute all mainland flights by railway displacements for resident tourists (which means that we exclude from the reallocation process the resident tourists flights with origin or destination to the Spanish islands and the Autonomous Spanish cities in Northern Africa, which accounted for 60% of total national flights in 2019 ( INE, 2022c )). Given the volatility in flight ticket prices and railway fares, we have applied the reallocation of expenditure considering both means of transport equivalent in terms of price per distance.
In Scenario 7, we propose, in addition to the more far-reaching changes in the consumption patterns of Scenario 6, improvements in energy efficiency. This is one of the pillars of both EU and Spanish strategies to involve the tourism sector in the Green transition ( European Commission, 2022 ) ( MINCOTUR, 2021a ). To address the expected impact on energy and emissions efficiency of present policy measures and commitments, we use estimations from the International Energy Agency ( IEA, 2017 ) in their reference technology scenario regarding buildings in services for the EU and the World. Based on this, we estimate total emissions per unit of energy consumed and their variation rate from 2014 to 2030 and apply it to the emission intensity (or emission coefficients) in monetary units of the accommodation and food services sector, assuming they change at the same rate. Specifically, we assume energy efficiency improvements in the food service and accommodation sector due to a decrease in the building emissions coefficient by 16% in the EU and 22% elsewhere. Another crucial sector in the evolution of tourist emissions is the transport sector and this is the focus of several policy measures aimed at increasing the electrification of the transport fleet, as in the EU Green Deal and in the Spanish Recovery, Transformation, and Resilience Plan ( European Commission, 2019 ; MINCOTUR, 2021b ). To include the expected impact on transport emissions of increasing electrification, we use estimations from UNWTO and ITF (2019) that provide the global average emissions per passenger kilometer (PKM) until 2030 distinguishing by travel mode under a current ambition scenario. Using these estimations, we calculate the corresponding variation rate of emissions PKM and apply it to the emission intensity of car and bus vehicles, assuming they evolve in the same way. As a result, we also introduce in scenario 7 energy efficiency improvements in land transport (23%) and road transport (34% in cars and 19% in buses) due to electrification ( UNWTO and ITF, 2019 ). (See additional explanations and Table SI.9 in SI).
3. Main results
3.1. tourism consumption patterns for 2019 and 2020.
As seen before, due to the Covid-19 pandemic, many tourists have changed the way they travel: their purposes for travelling, the means of transport they choose, where and how many days they stay in Spain, and what they spend their money on. All these consumption patterns have an associated environmental impact, which is the subject of study in this paper. Although tourism has a positive impact on the Spanish economy and creates jobs in many sectors throughout the value chain, the environmental impact must be considered to achieve the Paris Agreement Goals.
The next subsection will start our analysis of the tourism carbon footprint in Spain by comparing 2019 and 2020 to study the main changes and factors behind them. These are closely related to the evolution of tourism expenditure, which can be seen from the data available from TSA ( INE, 2022c ), transformed as described in Section 2 . Consequently, it is important to analyse, first, the consumption patterns and how they have changed. The vector of tourism consumption (aggregated to 14 sectors), with no distinction between the regions of origin of the goods or services, is shown in Table SI.5. The distribution of expenditures of tourism consumption shows a clear cut between Accommodation and food services activities (36%) and Real estate (16%), followed at a distance by Leisure (10%), Other activities (9%), Air transport (7%), and Land transport (5%), that altogether account for 84% of total tourism consumption in Spain (in 2019). It is important to note that we include the imputed rents of owner-occupied dwellings in Real estate, which explains that high share.
The impact of the pandemic was acutely felt by the tourism sector in Spain. Our figures show a decrease in total interior consumption of 63% between 2019 and 2020 (48% for resident consumption and 74% for non-resident). Before the pandemic, tourism accounted for 12.4 % of GDP, and Spanish tourism was in a moment of an economic boom in 2019, breaking a record in international tourist arrivals (83.7 million), which was 1.1% more than in 2018. Drilling down by origin of tourism, both non-resident and resident tourist also reached records of expenditure, as non-resident was growing at an annual rate of 2.8%, and resident tourist was growing at an even higher annual rate (3.7%) according to INE (2022b , 2022h) .
Not only did total spending decrease drastically, but there were also other relevant changes when looking at its composition: an increase in the share of resident vs. non-resident tourists’ expenditures, and changes in the weight of expenditure categories, are the two most relevant factors that can be identified ( Fig. 1 ). All of this influence the resulting emissions, as we will comment on below.

Expenditure patterns in 2019 and 2020 distinguishing between resident and non-resident tourists (million € and %)
Accommodation and Food services concentrate half of total expenditure for resident tourists, followed by Other activities. For non-resident tourists, Accommodation is even more important, but spending is more spread, so other categories such as Leisure, Real estate, Air transport, and Manufactures are at or above 9% of total expenditure. In terms of the change in patterns from 2019 and 2020, there was a reduction in the share of Accommodation and Air travel, and an increase of Food services, for resident tourists, while Accommodation and Air Travel kept its weight, and it was reduced for Food services, for non-resident tourists.
3.2. Carbon footprint results for 2019 and 2020
The changes in spending levels, origin of tourists, and consumption patterns explain the behaviour of emissions and their evolution between 2019 and 2020. Our results show that Spanish tourism generated a total carbon footprint of 47,825 ktCO 2 e in 2019, both in direct and indirect production, to cover all tourism consumption in Spain (14.2% of the total Spanish carbon footprint), and these emissions fell by 62.6% overall in 2020, amounting to only 17,970 ktCO 2 e (5.1% of the total Spanish carbon footprint). This reduction is detailed in Fig. 2 , distinguishing the origin of tourists (resident and non-resident). A distinctive feature of the effect of Covid-19 on tourism is the different impacts depending on that distinction, resident or non-resident tourists. Even though there is a substantial decrease in emissions from resident tourism (51%), the fall is much larger for inbound tourism (73%), replicating the evolution of expenditure with very similar percentage drops.

Carbon footprint and intensity of tourism in Spain by origin of expenditure, 2019 and 2020 (KtCO 2 e and KtCO 2 e per million €).
Out of the total tourism emissions generated in 2019, 33% were associated with the consumption of resident tourists (15,792 ktCO2e), while 62% were linked to non-resident visitors (29,428 ktCO2e). The remaining 5% corresponded to other expenditures related to tourism activities (imputed consumption of self-accommodation and other activities, and tourist transferences by public administration and non-profit organisations). One of the consequences of the pandemic is that the contribution of resident tourism to the 2020 carbon footprint increased to 44% while that of non-resident tourism decreased to 45% ( Fig. 2 ). Other tourism-related expenditures increased their share to 11% as their carbon footprint almost maintained 2019 levels.
Given these changes in the composition of tourism's carbon footprint, the question arises as to whether resident tourism is more or less polluting than foreign tourism. This comparison is represented by the dashed lines in Fig. 2 , which indicate the direct and indirect emissions generated per million euros of consumption by resident (orange dashed line) and non-resident tourists (grey dashed line). The chart shows that, on average, the consumption of non-resident tourists has a higher carbon intensity than that of residents in both 2019 and 2020. Besides, the evolution of the resident tourists’ intensity is better than that of non-residents. Interestingly, the outbreak of the pandemic and the change in tourist consumption patterns in that year caused a slight decrease in the carbon intensity of resident tourism, from 0.30 to 0.28 ktCO 2 e/million€ (-7%). In contrast, non-resident tourists’ consumption shows a slight increase in carbon intensity, from 0.36 to 0.38 (+3%).
This implies that the different evolution of emissions is not only related to changes in expenditure levels but also to differences in their consumption pattern. The spread found between the carbon intensities of resident and non-resident tourism is mainly explained by the distribution of their consumption by product. That is, non-resident tourists spend a higher proportion on goods and services with higher carbon intensities, especially Air transport, Manufactured goods, and Accommodation services, whereas resident tourists spend less on Transportation and have a greater tendency to spend on Food services and Other activities ( Figs. 1 and and3 ). 3 ). This can be illustrated by comparing the shares of the different product categories for expenditure ( Fig. 1 ) and emissions ( Fig. 3 ). For example, 24% of spending on Accommodation for non-resident tourists generates 8% of their emissions, while 9% of expenditures for Air travel results in around 30% of emissions.

Carbon footprint for resident and non-resident tourists by sectoral category of expenditure, 2019–20 (KtCO 2 e and %)
These disparities in consumption patterns translate into differences in the sectoral composition of the carbon footprint of each type of tourism. Fig. 3 presents the distribution of the carbon footprint of resident and non-resident tourists by type of products consumed in 2019 and 2020.
The adaptation of tourism to the pandemic-related restrictions reduced the share of some sectors in tourism consumption and carbon footprint. Both for resident and non-resident tourism, the carbon footprints of Air and Land transport were considerably diminished, reaching a reduction of -4,513 ktCO 2 e for resident tourists (57% of the total decrease between 2019 and 2020) and -9,616 ktCO 2 e for non-residents (45%). As a consequence of these sharp drops, the percentage share of Air and Land transport in the total carbon footprint of resident tourists contracted by 8 and 4 percentage points (pp), respectively. In the case of non-resident tourists, the fall in percentage participation was less pronounced, with -3 pp for both Air and Land transport. In both types of tourism, the reduction in the percentage share of transport in tourists' spending and carbon footprint was replaced by increases in the share of manufactures, which went up by 6 pp in the carbon footprint of resident tourists and 5 pp in that of non-residents. There are also other noticeable changes in many tourism-characteristic sectors: the Leisure sector has a higher share in non-residents emissions than in residents both in 2019 and 2020, while Food services and Other activities have a more significant role in resident emissions. Besides, Food services increase their weight in resident carbon footprint (2 pp), while Accommodation services decrease their participation (2 pp) in 2020.
Another way to illustrate this point is to look at percentage changes in emissions, rather than in terms of shares, between 2019 and 2020. By industries ( Fig. 4 ), the transport sectors led the great drop in emissions for both resident and non-resident tourists. In resident tourism, Land transport dropped by 67%, and Air transport decreased by 63%, while for non-residents, the highest reduction in emissions was in the Construction sector (81%) as well as transport sectors such as Land transport (80%), Other transport (79%) and Air transport (75%). In addition, sectors highly related to tourism also suffered significant falls, such as Accommodation (60%), Leisure (55%), and Food services (43%) in the resident carbon footprint, while in the case of non-resident tourists’ emissions, the reduction was even more profound. For example, Food services emissions by non-resident tourism decreased by 78%, Leisure activities by 75%, and Accommodation by 74%.

Change rates (2019–20) of carbon footprint by sectoral category of expenditure and origin of tourists (%)
The MRIO analysis also allows us to account for how many emissions are generated in each region and industry (where GHG are ultimately emitted). In terms of the origin of emissions for Spanish tourism, 56% of the total carbon footprint in 2019 (26,903 out of 47,825 ktCO 2 e) was generated in Spain, while the remaining 44% was embodied in imported products, with very similar percentages for resident and non-resident tourists (although slightly higher imported emissions for these last ones, 45% compared to the 43% of resident tourists).
In 2020, the impact of the pandemic on this aspect was very limited, as the percentage of emissions embodied in imports increases by 1 pp. Out of the total 17,970 ktCO 2 e that constitute the carbon footprint of interior tourism in Spain in 2020, 9,932 ktCO 2 e were domestic emissions (55%), and 8,038 ktCO 2 e were imported (45%), so it is, directly or indirectly, embodied in the global production chains. As Fig. 5 A shows, a large part of the imported emissions come from European countries such as France (2.6%), United Kingdom (1.4%), Germany (1.1%), Italy (0.6%), and other EU (4.4%), from China (3.1%), BRIIAT (5.6%), and the United States (1.8%), but a significant amount (24.3%) also fall within the Rest of the world category (RoW) due to the high contribution of Transport and Manufactures (that includes coke and refined petroleum), as well as Agriculture and mining.

Spanish tourism carbon footprint in BAU 2019 and 2020 and in the scenarios proposed for 2021 (ktCO 2 e and %).
Note to Fig. 6 : The reduction percentages shown at the top of the bars have been calculated based on the 2019 level.

Carbon footprint of interior touristic consumption in Spain in 2020 A) By emitting countries (%), B) By product of final demand (%)
The percentage of domestic or imported emissions in the tourism carbon footprint differs significantly by sector when accounting for all the emissions embodied in their final product (including then emissions embodied in all the inputs the final product requires). On the one hand, emissions in Electricity, water, gas, and waste industry products (85%), Air transport (75%), and Other transport (90%) are primarily domestic. In contrast, emissions in Manufactures (78%), Agriculture and mining (67%), and Land transport (68%) are predominantly imported. There are other sectors, such as Leisure activities, Accommodation services, and Food services, in which at least 40% of their emissions are imported, which shows the relevance of global value chains in Spanish tourism-characteristic products. From the point of view of the ultimate sectors where emissions are generated, Agriculture and mining is the main responsible (32.5%, of which 79.8% are emitted abroad), followed by Air transport (21.9%, of which only 7.7% are imported), and Electricity, water, gas, and waste (18.5% of total carbon footprint, of which one third takes places outside the Spanish borders).
3.3. Carbon footprint results for scenarios and reduction targets
Given the differences in consumption patterns and tourist origin identified in the previous subsections, we now proceed to analyse the carbon footprint for tourism within the Spanish borders for the scenarios described in Section 2 ( Table 1 ). These combine the different factors identified in the descriptive section: drop in tourism expenditure, changes between the share of resident and non-resident tourists, and changes in consumption patterns (due to variations in means of transport, destination, or type of tourism activities). We also include the potential effect of policies aimed at increasing energy efficiency and inducing changes in transportation.
The first scenario (SC1) considers a full recovery of the 2019 expenditure level led by resident tourists (whose carbon intensity is lower, as shown before) with a return to the 2019 consumption pattern. SC1 generates a carbon footprint of 46,471 ktCO 2 e, for which resident tourism is responsible for 49%. Specifically, resident tourism generates 7,000 ktCO 2 e more than in 2019, but non-resident tourism reduces its emissions even more, so the total carbon footprint decreases by 3%. This scenario shows a cleaner recovery in relation to the 2019 level even if we continue with the 2019 emissions pattern, which implies higher spending shares related to products characteristic of tourism and transport (highly polluting) than in 2020. This is because resident tourism spends more on Accommodation and Food services (which are less carbon-intensive) and less on Air transport and Manufactures than non-resident. Hence, its leadership in the recovery offsets the effect of the back-to-2019 consumption pattern.
In 2020, Spanish tourism broke another record (downward) with a drop in expenditure never seen before, and tourism lost more than half of its weight in GDP. The economic and social disruption caused by the pandemic led to an increase in the percentage of tourists staying in their own homes or in friends' or relatives’ homes, both for resident (from 64% to 68%) and non-resident tourists (from 18% to 27%), probably due to health reasons as well as economic problems ( INE, 2022b , 2022h ). That year, the carbon footprint amounted to 17,970 ktCO 2 e, as it changed both the pattern and the level of expenditure. Regarding resident tourists, they spent less on accommodation and food services, leisure activities, and land and air transport, while other activities and real estate/rental activities increased their share of total spending. In the case of non-resident tourists, the share of accommodation and food services fell by a smaller percentage than for resident, leisure also decreased its share, while expenditure on manufactures increased its participation in total expenditure. These changes between sector shares are introduced in scenarios 2 (SC2) and 4 (SC4), which include the consumption pattern resulting from the impact of Covid-19.
Beginning with the SC4, it proposes a full recovery of the 2019 expenditure level but considering the changes in the consumption pattern due to health and psychological reasons. Under this scenario, an additional 4,059 ktCO 2 e are emitted compared to 2019 (8% higher) due to increased emissions generated by non-resident tourism and other components. This means that the persistence of consumption pattern changes derived from the pandemic would result in a highly polluting scenario if the pre-pandemic level of expenditure is reached, making it harder for the tourism sector to reverse course in the fight against climate change.
Unlike the previous scenarios that propose a recovery of the 2019 spending level, scenario 2 presents a partial recovery considering the actual figures of tourists' expenditure in 2021. In that year, with the relaxation/easing of restrictions and the improvement of the health and economic situation, total expenditure and number of visitors have increased rapidly, although they are still far from reaching the pre-pandemic level. Given this partial recovery, SC2 asks what would happen if tourists returned to their pre-Covid-19 consumption pattern. Our results show a carbon footprint of 29,797 ktCO 2 e, in which resident tourists account for 41% and non-resident tourists for 48%. This implies an increase of 11,826 ktCO 2 e with respect to 2020 (66% more) but 18,028 ktCO 2 e less (-38%) than in 2019.
Moving on to scenario 3 (SC3), this suggests a partial recovery in spending (as in SC2), but assuming tourists return to the same pre-Covid-19 consumption patterns since their changes in 2020 were temporary and part of exceptional health and economic circumstances. This recovery scenario leads to a lower carbon footprint (27, 352 ktCO 2 e) than SC2, with a higher share of emissions from resident tourism (46%), whose carbon intensity is lower.
Another question we try to answer with these scenarios is whether trend changes in the motivation for tourism, as observed during 2020 and 2021, could have a relevant impact on emissions. Scenario 5 (SC5) is slightly different from the previous ones since we apply a full recovery (as in SC1 and SC4) but increase the type of sun and beach tourism and decrease cultural and other leisure tourism, which also implies a change in consumption patterns. Taking this into account, we show that the corresponding changes in consumption patterns do not result in significant changes in emissions, as they tend to compensate for each other in terms of pollution. Specifically, under this scenario, 47,869 ktCO 2 e are emitted, practically the same as in 2019, with a negligible increase of 0.1%. Furthermore, differentiating by tourism origin, non-resident tourism increases slightly while resident tourism decreases so that overall, both effects are neutralised.
In any case, the lesson from those first five scenarios is that the only significant reductions in emissions are due to the decrease in the level of expenditure, as reflected in SC2 and SC3 (partial recovery). Changing the distribution between resident and non-resident tourists only reduces emissions by 3%, while other trends leave the total carbon footprint unchanged or it even increases. These scenarios show the need for more radical and far-reaching changes both in the level and pattern of consumption, as even continuing with the pattern adopted due to Covid-19 would worsen the emissions results and require greater efforts to reduce them. Thus, scenario 6 (SC6) and 7 (SC7) point to these more radical changes.
SC6 shows what would happen if tourists shifted their demand from air transport to land transport (which is more sustainable), only where this is more feasible for both domestic and international journeys of nearby countries (see Section 2.3 ). The results show that, if the recovery path continues and the pattern of expenditure remains as in 2019 except for the shift in transport, the carbon footprint would only be reduced by 2,184 ktCO 2 e compared to 2019 (5% lower), where 1,500 ktCO 2 e are due to a fall in resident tourism. Within resident tourism, Air transport would lose more than 10 pp share in the carbon footprint (from 32% to 21%), while in non-resident tourism Air transport would decrease its weight in the carbon footprint from 32% to 30%.
The aforementioned scenarios are based on changes in emissions from consumer responsibility and are focused on tourists’ final demand. The novelty of Scenario 7 (SC7) is that it continues along the lines of radical change to considerably reduce emissions (as SC6), but adds changes on supply, incorporating improvements in energy efficiency, resulting from current policy measures and understanding that the evolution towards sustainability must also be driven by technology. SC7 achieves the largest reduction in carbon footprint in relation to the other scenarios that also consider full recovery at the pre-pandemic-2019 level. Specifically, the carbon footprint would amount to 35,919 ktCO 2 e, which is double the figure in 2020 but represents a 25% reduction compared to 2019.
In summary, under a partial recovery of the economy, SC2 and SC3 show tourism emissions reductions near 40%, while under a full recovery there would be a 25% reduction in emissions only if we adopt the strategies of SC7. The other proposed scenarios show that changes in consumption patterns have a slight impact on the tourism carbon footprint and are insufficient to reduce emissions if they are not coupled with reductions in the spending level or energy efficiency improvements. At this point, the question arises of how much the tourism sector must reduce emissions to achieve the 2030 and 2050 reduction targets and whether the proposed scenarios are aligned with these targets.
As an intermediate step towards climate neutrality in 2050 (the so-called Net-Zero), the EU has set a reduction target of at least 55% by 2030 from 1990 ( EU, 2021 ). Table 2 shows how to achieve these reduction targets (2030 and 2050) under a scenario of the Spanish economy and tourism growth. First, the reduction goals require the GHG emissions footprints shown in Table 2 for the whole Spanish economy and for the interior tourism in Spain, which have been calculated by applying the percentage reductions proposed by the EU to the 1995 footprints from Cadarso et al. (2016) estimations and the 2019 footprints calculated in this paper. In addition, the expected final demand in 2030 and 2050 for the whole economy and the interior tourism demand in Spain have been estimated by assuming a constant average growth of tourism GDP equal to the recent pre-Covid years ( INE, 2022d ). This implies that tourism final demand would grow by more than 65% by 2030. Besides, the Spanish carbon footprint of tourism has increased by 25% since 1995 (based on ( Cadarso et al., 2016 ) estimations). Therefore, tourism needs to make additional efforts to be on track toward decarbonisation.
Decarbonisation rates for tourism in Spain and Spanish economy to net-zero target.
Source: own elaboration based on data and methods described in Section 2 .
Note to Table 2 : The annual decarbonisation rate on emissions intensity has been calculated as the difference between the annual decarbonisation rate and the annual growth rate applied to the final demand (2.5947% in the case of the Spanish economy and 4.7091% in the case of the interior tourism in Spain), obtained from ( INE, 2022d , INE, 2022e ). 2050 targets are calculated as percentual reductions on 2019 values following the goals set in ( EU, 2021 ). Reduction targets in 2030 are calculated by taking 1995 GHG emissions footprints according to the goal set in ( EU, 2021 ). Data for 1995 has been retrieved from Cadarso et al. (2016) .
According to Table 2 , if production continues to grow, the annual decarbonisation rate should be between 7% and 14% for the Spanish economy and tourism, and emissions intensity should be reduced by at least 10% in the Spanish economy and 12% in tourism annually. However, it must be considered that the interior tourism footprint gathers emissions from both tourism-characteristic sectors and other industries included in its supply chain. For this reason, the reduction in tourism-specific sectors could be less ambitious than shown in Table 2 if the decrease in other activities, such as energy generation or manufacturing, is higher. Nevertheless, transport -a tourism-characteristic industry- is the main component of the tourism carbon footprint, as previously shown in Fig. 3 , so decarbonisation efforts to reduce the tourism footprint should be directed to these activities.
Linking it with the proposed scenarios, Table 3 shows how much emissions reduction each scenario generates over the total emissions reduction needed to reach the Net Zero target. Overall, they are insufficient to achieve decarbonisation, even in the last scenario (SC7), which is the most ambitious and contributes to a total reduction of 26% (-43% for domestic and -4% for imported) to the necessary 95% reduction in 2050. The other scenarios, under a total recovery of the 2019 tourism demand, are absolutely not aligned with the decarbonisation pathway, as they only contribute to reducing between 3 and 5% of the required total carbon footprint drop, and some of them even generate additional emissions.
Output, emissions, and emissions efficiency of tourism and national economy for Spain, 2019 and scenarios (million €, ktCO 2 e, ktCO 2 e per million €).
Note to Table 3 . Percentages in parenthesis correspond to the reduction (<0) or increment (>0) in GHG emissions that each scenario represents on the fall of 42,990.3 tCO 2 eq that should be achieved in the tourism footprint in 2050 concerning the 2019 value (95% of reduction) distinguishing between domestic and imported. Scenarios 2 and 3 contain an additional percentage in italics corresponding to the reduction/increment calculated by extrapolating the emissions that these scenarios would generate with a total recovery of the 2019 final demand.
This is consistent with previous findings for the global economy, like Peeters and Dubois (2010) , that backcasted required annual increases in energy efficiency of 2.3% in air travel, 3% for cars, and 2% in accommodation, for a period of 30 years. This would amount to double the technological advances introduced in our SC7. In terms of changes in transportation, land transportation would need to increase more rapidly, up to 4.4% per year, to substitute short-haul air travel, according to Dubois et al. (2011) . We must add that this increase must come together with the electrification of new vehicles as set in EU and Spanish strategies.
4. Discussion and conclusions
The Glasgow Declaration on Climate Action in Tourism, which set the goals of reducing emissions by 50% before 2030 and achieving Net Zero by 2050 at the latest, proposed five lines of action: measurement, decarbonisation, regeneration, collaboration, and finance. In terms of measuring, the use of carbon footprints, with a clear and established methodology, as in this paper, is an important step, moving from producer and territorial towards consumer responsibility.
Tourism's potential to contribute to SDG has been highlighted by many studies ( Lasisi et al., 2020 ; Palacios-Florencio et al., 2021 ; Scheyvens and Hughes, 2019 ) and policy initiatives (for example, the Tourism for SDGs platform by UNWTO). In this paper, we have focused on their contribution to carbon emissions and climate change, quantifying the results from some of the recent trends in the sector, with particular attention to the transformative events from Covid-19 and beyond, and assessing their impact on tourism carbon footprint. The tourism sector was one of the hardest hits by the pandemic, and its recovery process faces significant challenges because it needs to increase resilience and, in the EU, accelerate its transition to a greener and digital model.
Our calculations show that the decrease in tourism activities due to the pandemic, extreme as it was, reduced emissions to the level where the objectives of decarbonisation for the sector are currently aimed. This is the most precise illustration of how complex, in the present context of forecasted demand increases, the net zero goal can be unless drastic changes in carbon efficiency, particularly in transport, but not restricted to it, occur. In line with the reflections of Becken (2019) , higher ambition is needed, and only changes at a large scale would have the required impact.
These results are consistent with previous literature looking at impacts from tourism scenarios, both pre- and post- pandemic. For example, Peeters and Dubois (2010) , Dubois et al. (2011) , Jones (2013) for Wales, Ghislain and Jean Paul (2019) for Brazil, and Sun et al. (2022) for Norway. All those find it very difficult to reduce emissions below current levels, even after including substitution for air travel and increases in energy efficiency beyond those shown in recent trends. The most common conclusion remains committing to decrease emissions as much as possible with large-scale changes, including relevant reductions in global tourism demand (starting with business and frequent travel), reductions in air travel in particular (especially short-haul), and distances travelled, together with essential investment plans to speed up technological advances (such as digitalisation), retrofit buildings, and improve the infrastructure. We discuss more profound some of these in the following.
Regarding tourism demand, economic crises, rising energy prices, and other unforeseen events may delay the growth in demand and, therefore, emissions. But if our development strategies are still focused on tourism as a source of GDP and employment, we must consider various tools to mitigate its environmental impact. Although there is a consensus on taking the pandemic impact as an opportunity to increase tourism sustainability and resilience ( Gössling and Schweiggart, 2022 ), the risk of prioritising growth and forgetting the environmental goals also arises ( Mkono et al., 2022 ). The results obtained in the recovery scenarios provide empirical support to those who consider returning to pre-Covid tourism situation undesirable in the recent binary debate “recovery or reform” ( Higgins-Desbiolles, 2021 ). Furthermore, special care should be taken regarding possible rebound effects once the pandemic situation is finally under control and confidence indicators recover. The longing to return to normal or make up for a lost time, together with the savings due to lower consumption during pandemic times, can boost tourism, as it has already started to become apparent in tourism figures for 2022, making it harder to achieve the emission reduction goals.
Another large-scale change is digitalisation. An increasingly digitalised tourism sector can help to meet demand in a sustainable manner, particularly for some forms of tourism, for instance, cultural and leisure. Virtual tourism was one of the avenues proposed to keep the tourism industry going, but it can also serve as a launching platform for the future ( Pillai, 2021 ). Augmented, virtual, or mixed reality could help reduce some of the longest travel distances, particularly in already massified destinations.
Changes in tourists’ consumption patterns resulting from the pandemic are not enough to make tourism more sustainable, and less carbon emitter if they imply pre-pandemic consumption levels (even worse, demand growth), as our results show. Only more radical behavioural changes significantly impact the tourism carbon footprint, especially if they are combined with improvements in industry energy and emissions’ efficiency (for example, reducing the energy intensity per euro and increasing energy from renewable sources). However, changes in consumption patterns as a source of emissions reductions could have untapped potential, based on the last Eurobarometer survey. The survey results are promising to effectively achieve deeper changes because they pointed out that 82% of Europeans are willing to change their travel habits for more sustainable practices, including consuming locally sourced products, reducing waste and water consumption, travelling off-season or to less visited destinations, and choosing transport options based on their ecological impact ( European Commission, 2021 ).
Reducing the distances tourists travel and substituting air with rail travel (and/or electric vehicles) when possible is an obvious policy that is considered. For example, the Spanish and French green strategies recommend banning flights when there is a viable rail alternative (trips of less than 2.5 h, but it could even be reduced to 1 h, following the International Energy Agency net-zero roadmap ( IEA, 2021 ), that also proposes holding long-haul, over 6 h, flights to 2019 levels). Our results show a limited impact for the Spanish case if applied to the minimum (domestic and nearby countries), but still worthwhile. It is also essential to notice that we have not included any reduction in flights to the Spanish Canary and Balearic archipelagos, a specific part of tourism in this country that will continue to be met mostly with air travel.
Furthermore, regarding the green transition, the EU proposes harmonised rules on the uptake and supply of sustainable aviation and maritime fuels. But as they can take some time to effectively impact the emissions intensity of maritime and air transport, the EU also looks to boost a smart and sustainable network with long-distance, night, and cross-border passenger rail services ( European Commission, 2022 ). This should allow for increasing the potential substitution of air travel by further spreading the distance range of accessible rail trips.
Offsetting emissions has also become a more common strategy, both for airlines and hotels, and it is also promoted by international organisations ( UNWTO, 2021 ). For the focus of this paper, GHG emissions, the traditional carbon credits exchanged in carbon trading markets and aimed at compensating emissions with other activities that capture CO 2 (tree planting, for example), could also be a contributing element. Nevertheless, for a more global approach to sustainability, it would also be crucial to target those offsetting measures so that they tend to compensate for the negative impacts from other policy tools on employment or GDP, wherever those effects are mostly felt.
Other policies that could help reduce the impact of tourism should be centred on improving the infrastructure so most tourism-related activities should be accessed using public electric transport, rather than relying on private cars. Similarly, infrastructure policies should also be directed so passengers can move better from airports to city centres using public electric transport. Subsidising rental car companies to go full electric is another measure that could provide some positive results, particularly in the coastal and island destinations. In addition, current campaigns in favour of using seasonal produce should be better targeted to tourism food services, in the same way that awareness campaigns about the indoor temperature in tourism accommodations. Finally, current policy measures destined to improve building energy efficiency and insulation could also be ramped up for hotels and other types of accommodation.
General policies for most national industries can also be relevant when focusing on the tourism sector. Our results show the relevance of global value chains in generating those emissions, with 44% of total emissions embodied in imports required for the tourist sector on average. Changes in the structure of those chains (nearshoring and source shifting) could reduce the embodied emissions of the inputs needed for this sector by decreasing the distances travelled by those products and reallocating activity to lower carbon-intensity production centres. Efforts directed to transform our economies towards a more circular approach, for example, reducing waste (particularly food waste) and increasing recycling, can also improve our chances of making tourism cleaner.
Finally, it is relevant to conclude this paper by commenting on the feasibility of these potential changes for the Spanish tourism industry. When analysing the transition risks involved, four key indicators have been proposed ( Scott and Gössling, 2022 ): (1) fossil fuels share in electricity generation, (2) average distance from the top five countries of regions where income tourism originates, (3) size of the outbound international tourism, and (4) dependency on imported food. Spain is one of the leading countries in renewable energies, and it has developed a reasonably advanced (high-speed and electrified) rail system over decades. It is, however, well behind other EU countries in its share of electric vehicles and the required charging infrastructure. Over 90% of international tourists are European, but around 14% are British ( INE, 2022i ), and a significant proportion of arrivals are directed to the islands. Expenditure from outbound tourism represented 34% of that of inbound tourism in 2019 ( INE, 2022d ), showing some capacity for substitution. Spain is also a net food exporter, but it remains vulnerable to potential increases in carbon taxes or costs for transported goods, particularly for manufactures. Therefore, we can conclude that Spain is not worse off than most countries heavily reliant on tourism, but that the challenges for global tourism to achieve a net-zero path are so immense that except for fast technological advances and decided investment plans, radical shifts in touristic level and behaviour will be required. These will also need joint mitigation programs and compensating policies for those regions and workers most affected.
This work was supported by the Government of Castilla-La Mancha and the European Union [EVACORRES (CLM21-PIC-054)]. This work was supported by the University of Castilla-La Mancha (20222-GRIN-34177) Á. García-Alaminos acknowledges financial support from the Spanish Ministry of Universities through the National FPU Program (Grant ref. FPU18/00738). P. Osorio acknowledges financial support from the “Programa Investigo” (2022-INVGO-11109), as part of the Recovery, Transformation and Resilience Plan, funded by the European Union, Next Generation EU (Government of Spain, Ministry of Labour and Social Economy, Public Employment Services, Regional Government of Castilla-La Mancha, University of Castilla-La Mancha). Open Access funding is provided by the University of Castilla-La Mancha.
CRediT authorship contribution statement
Pilar Osorio: Methodology, Writing – original draft, Visualization. María-Ángeles Cadarso: Conceptualization, Methodology, Writing – original draft. María-Ángeles Tobarra: Conceptualization, Methodology, Data curation, Writing – original draft. Ángela García-Alaminos: Methodology, Data curation, Software, Writing – original draft.
Declaration of Competing Interest
The authors declare that they have no known competing financial interests or personal relationships that could have appeared to influence the work reported in this paper.
1 CO 2 GWP 100-year = 1; CH 4 GWP 100-year = 28; Fossil CH 4 GWP 100-year = 30; N 2 O GWP 100-year = 265
Supplementary material associated with this article can be found, in the online version, at doi:10.1016/j.strueco.2023.03.003 .
Appendix. Supplementary materials
Data availability.
- Becken S. Decarbonising tourism: mission impossible? Tour. Recreat. Res. 2019; 44 :419–433. [ Google Scholar ]
- Cadarso M.Á., Gómez N., López L.A., Tobarra M.Á., Zafrilla J.E. Quantifying Spanish tourism's carbon footprint: the contributions of residents and visitors: a longitudinal study. J. Sustain. Tour. 2015; 23 :922–946. [ Google Scholar ]
- Cadarso M.Á., Gómez N., López L.A., Tobarra M.Á. Calculating tourism's carbon footprint: measuring the impact of investments. J. Clean. Prod. 2016; 111 (Part B):529–537. [ Google Scholar ]
- Cadarso M.Á., Tobarra M.Á., García-Alaminos A., Ortiz M., Gómez N., Zafrilla J. In: Advances of Footprint Family For Sustainable Energy and Industrial Systems. Ren J., editor. Springer Nature; Switzerland: 2021. The input–output method for calculating the carbon footprint of tourism: an application to the spanish tourism industry. [ Google Scholar ]
- Cadarso M.Á., Tobarra M.Á., García-Alaminos Á., Ortiz M., Gómez N., Zafrilla J. In: Advances of Footprint Family For Sustainable Energy and Industrial Systems. Ren J., editor. Springer International Publishing; Cham: 2022. The input–output method for calculating the carbon footprint of tourism: an application to the spanish tourism industry; pp. 35–57. [ Google Scholar ]
- Cardenete M.A., Delgado M.d.C., Villegas P. Impact assessment of Covid-19 on the tourism sector in Andalusia: an economic approach. Curr. IssuesTour. 2022; 25 :2029–2035. [ Google Scholar ]
- Castro-Nuño M., Molina-Toucedo J.A., Pablo-Romero M.P. Tourism and GDP: a meta-analysis of panel data studies. J. Travel Res. 2013; 52 :745–758. [ Google Scholar ]
- Cazcarro I., Hoekstra A.Y., Chóliz J.S. The water footprint of tourism in Spain. Tour. Manag. 2014; 40 :90–101. [ Google Scholar ]
- Chiambaretto P., Mayenc E., Chappert H., Engsig J., Fernandez A.S., Le Roy F. Where does flygskam come from? The role of citizens’ lack of knowledge of the environmental impact of air transport in explaining the development of flight shame. J. Air Transp. Manag. 2021; 93 [ Google Scholar ]
- Davis S.J., Caldeira K. Consumption-based accounting of CO 2 emissions. Proc. Natl. Acad. Sci. 2010; 107 :5687–5692. [ PMC free article ] [ PubMed ] [ Google Scholar ]
- Deb S.K., Ahmed S.A. Managing post Covid-19 crisis in the tourism and hospitality sector through sustainable recovery strategies. Geoj. Tour. Geosites. 2022; 43 :993–1004. [ Google Scholar ]
- Dorninger C., von Wehrden H., Krausmann F., Bruckner M., Feng K., Hubacek K., Erb K.H., Abson D.J. The effect of sindustrialisation and sglobalisation on domestic land-use: a global resource footprint perspective. Glob. Environ. Change. 2021; 69 [ Google Scholar ]
- Dubois G., Peeters P., Ceron J.P., Gössling S. The future tourism mobility of the world population: emission growth versus climate policy. Transp. Res. Part A Policy Pract. 2011; 45 :1031–1042. [ Google Scholar ]
- EU . European Parliament and The Council; 2021. European Climate Law 2021/1119. [ Google Scholar ]
- European Commission . European Commission; 2019. The European Green Deal. Communication from the Commission to the European Parliament, the European Council, the Council, the European Economic and Social Committee and the Committee of the Regions Brussels, 11.12.2019. [ Google Scholar ]
- European Commission . Eurobarometer Survey; 2021. Attitudes of Europeans towards Tourism. https://europa.eu/eurobarometer/surveys/detail/2283 europa.eu. [ Google Scholar ]
- European Commission . European Commission; 2022. Transition Pathway For tourism. Directorate-General for Internal Market, Industry, Entrepreneurship SMEs. [ Google Scholar ]
- García-Alaminos Á., Gilles E., Monsalve F., Zafrilla J. Measuring a university's environmental performance: a sstandardised proposal for carbon footprint assessment. J. Clean. Prod. 2022; 357 [ Google Scholar ]
- Ghislain, D., Jean Paul, C., 2019. The future GHG emissions of tourism by Brazilians. Current Issues in Tourism, pp. 1742-1757.
- Gobierno de España . 2021. Plan De recuperación, Transformación y Resiliencia. [ Google Scholar ]
- Gössling S., Peeters P. Assessing tourism's global environmental impact 1900–2050. J. Sustain. Tour. 2015; 23 :639–659. [ Google Scholar ]
- Gössling S., Schweiggart N. Two years of Covid-19 and tourism: what we learned, and what we should have learned. J. Sustain. Tour. 2022; 30 :915–931. [ Google Scholar ]
- Gössling S., Scott D., Hall C.M. Pandemics, tourism and global change: a rapid assessment of Covid-19. J. Sustain. Tour. 2021; 29 :1–20. [ Google Scholar ]
- Gueddari-Aourir A., García-Alaminos A., García-Yuste S., Alonso-Moreno C., Canales-Vázquez J., Zafrilla J.E. The carbon footprint balance of a real-case wine fermentation CO 2 capture and sutilisation strategy. Renew. Sustain. Energy Rev. 2022; 157 [ Google Scholar ]
- Hall C.M., Scott D., Gössling S. Pandemics, transformations and tourism: be careful what you wish for. Tour. Geogr. 2020; 22 :577–598. [ Google Scholar ]
- Higgins-Desbiolles F. The “war over tourism”: challenges to sustainable tourism in the tourism academy after Covid-19. J. Sustain. Tour. 2021; 29 :551–569. [ Google Scholar ]
- IEA . International Energy Agency; 2017. Energy Technology Perspectives 2017. [ Google Scholar ]
- IEA . International Energy Agency; 2021. Net Zero by 2050: A Roadmap For the Global Energy Sector (4th Revision) [ Google Scholar ]
- INE . Instituto Nacional de Estadística; 2022. Consumer Prices index, 04/01/2022 ed. [ Google Scholar ]
- INE . EGATUR. Instituto Nacional de Estadística, INE; 2022. International Tourists Expenditure Survey. [ Google Scholar ]
- INE . Instituto Nacional de Estadística, INE; 2022. Passenger Transport Statistics. [ Google Scholar ]
- INE . Instituto Nacional de Estadística; 2022. Satellite Account for the Tourism in Spain. 2016–2020 Series. Statistical revision 2019, 04/01/2022 ed. [ Google Scholar ]
- INE . Instituto Nacional de Estadística; 2022. Spain National Accounts.Volume Variations. [ Google Scholar ]
- INE . Instituto Nacional de Estadística; 2022. Spain National accounts: Supply and Use tables. Supply table At Basic Prices Including the Transformation Into Purchaser prices. Current prices., 04/01/2022 ed. [ Google Scholar ]
- INE . Instituto Nacional de Estadística; 2022. Spain National accounts: Supply and Use tables. Use table At Purchasing prices. Current prices., 04/01/2022 ed. [ Google Scholar ]
- INE . Instituto Nacional de Estadística, INE; 2022. Survey of Resident Tourism. ETR/Familitur, 2020-2021. ed. [ Google Scholar ]
- INE . Instituto Nacional de Estadística, INE; 2022. Tourist Movement on Borders Survey (FRONTUR) [ Google Scholar ]
- IPCC . In: Contribution of Working Group I to the Fifth Assessment Report of the Intergovernmental Panel On Climate Change. Stocker T.F., Qin D., Plattner G.K., Tignor M., Allen S.K., Boschung J., Nauels A., Xia Y., Bex V., Midgley P.M., editors. Cambridge University Press; Cambridge, United KingdomNew York, USA: 2013. Climate change 2013: the physical science basis; p. 1535. [ Google Scholar ]
- Jones C. Scenarios for greenhouse gas emissions reduction from tourism: an extended tourism satellite account approach in a regional setting. J. Sustain. Tour. 2013; 21 :458–472. [ Google Scholar ]
- Khan K.I., Nasir A., Saleem S. Bibliometric analysis of post Covid-19 management strategies and policies in hospitality and tourism. Front. Psychol. 2021; 12 [ PMC free article ] [ PubMed ] [ Google Scholar ]
- Kitamura Y., Ichisugi Y., Karkour S., Itsubo N. Carbon footprint evaluation based on tourist consumption toward sustainable tourism in Japan. Sustainability. 2020; 12 :2219. [ Google Scholar ]
- Kuo C.W. Can we return to our normal life when the pandemic is under control? A preliminary study on the influence of Covid-19 on the tourism characteristics of Taiwan. Sustain. 2021; 13 :9589. [ Google Scholar ]
- Lasisi T.T., Alola A.A., Eluwole K.K., Ozturen A., Alola U.V. The environmental sustainability effects of income, labour force, and tourism development in OECD countries. Environ. Sci. Pollut. Res. 2020; 27 :21231–21242. [ PubMed ] [ Google Scholar ]
- Lee L.C., Wang Y., Zuo J. The nexus of water-energy-food in China's tourism industry. Resour. Conserv. Recycl. 2021; 164 [ PMC free article ] [ PubMed ] [ Google Scholar ]
- Lenzen M., Geschke A., West J., Fry J., Malik A., Giljum S., Milà i Canals L., Piñero P., Lutter S., Wiedmann T., Li M., Sevenster M., Potočnik J., Teixeira I., Van Voore M., Nansai K., Schandl H. Implementing the material footprint to measure progress towards sustainable development goals 8 and 12. Nat. Sustain. 2022; 5 :157–166. [ Google Scholar ]
- Lenzen M., Sun Y.Y., Faturay F., Ting Y.P., Geschke A., Malik A. The carbon footprint of global tourism. Nat. Clim. Change. 2018; 8 :522–528. [ Google Scholar ]
- Mahajan S., Beutel J., Guerrero S., Inomata S., Larsen S., Moyer B., Remond-Tiedrez I., Rueda-Cantuche J., Simpson L., Thage B., Rompaey C., Verbiest P., DiMatteo I., Matteo I., Kolleritsch E., Alsammak I., Brown G., Cadogan A., Elliot D., Havinga I. 2018. Handbook On Supply, Use and Input-Output Tables with Extensions and Applications. [ Google Scholar ]
- Manrique-de-Lara-Peñate C., Santana Gallego M., Valle E.V. The economic impact of global uncertainty and security threats on international tourism. Econ. Model. 2022; 113 [ Google Scholar ]
- Marques Santos A., Madrid González C., Haegeman K., Rainoldi A. European Commision and Joint Research Centre, Luxembourg. Publications Office of the European Union; 2020. Behavioural Changes in Tourism in Times of Covid-19: Employment Scenarios and Policy Options. [ Google Scholar ]
- Miller R.E., Blair P.D. 3rd ed. Cambridge University Press; Cambridge: 2022. Input-Output Analysis: Foundations and Extensions. [ Google Scholar ]
- MINCOTUR . Ministerio de Industria, Comercio y Turismo versión revisada en marzo 2022; 2021. Estrategia De Sostenibilidad Turística En Destinos. https://turismo.gob.es/es-es/estrategia/V2022_Estrategia_Sostenibilidad_Turistica_Destino.pdf [ Google Scholar ]
- MINCOTUR . Ministerio de Industria, Comercio y Turismo Plan de recuperación, Transformación y resiliencia; 2021. PERTE Para El Desarrollo Del Vehículo Eléctrico y Conectado. https://www.mincotur.gob.es/es-es/recuperacion-transformacion-resiliencia/Paginas/perte.aspx [ Google Scholar ]
- Minx J.C., Wiedmann T., Wood R., Peters G.P., Lenzen M., Owen A., Scott K., Barrett J., Hubacek K., Baiocchi G., Paul A., Dawkins E., Briggs J., Guan D., Suh S., Ackerman F. Input-output analysis and carbon footprinting: an overview of applications. Econ. Syst. Res. 2009; 21 :187–216. [ Google Scholar ]
- Mkono M., Hughes K., McKercher B. Does the environment matter in the ‘new normal’? Ann. Tour. Res. Empir. Insights. 2022; 3 [ Google Scholar ]
- OECD . OECD; 2020. Mitigating the Impact of Covid-19 On Tourism and Supporting Recovery. [ Google Scholar ]
- Palacios-Florencio B., Santos-Roldán L., Berbel-Pineda J.M., Castillo-Canalejo A.M. Sustainable tourism as a driving force of the tourism industry in a post-Covid-19 scenario. Soc. Indic. Res. 2021; 158 :991–1011. [ PMC free article ] [ PubMed ] [ Google Scholar ]
- Peeters P., Dubois G. Tourism travel under climate change mitigation constraints. J. Transp. Geogr. 2010; 18 :447–457. [ Google Scholar ]
- Peters G.P. From production-based to consumption-based national emission inventories. Ecol. Econ. 2008; 65 :13–23. [ Google Scholar ]
- Pillai, A., 2021. How virtual tourism can rebuild travel for a post-pandemic world. World Economic Forum, May 2021, Retrieved from https://www.weforum.org/agenda/2021/05/covid-19-travel-tourism-virtual-reality/ .
- Prideaux B., Thompson M., Pabel A. Lessons from Covid-19 can prepare global tourism for the economic transformation needed to combat climate change. Tour. Geogr. 2020; 22 :667–678. [ Google Scholar ]
- Qiu R.T.R., Park J., Li S., Song H. Social costs of tourism during the Covid-19 pandemic. Ann. Tour. Res. 2020; 84 [ PMC free article ] [ PubMed ] [ Google Scholar ]
- Reuters . Reuters; 2021. French Lawmakers Approve a Ban On Short Domestic Flights. reuters.com April 11, 2021. [ Google Scholar ]
- Rodousakis N., Soklis G. The Covid-19 multiplier effects of tourism on the German and Spanish economies. Evolut. Inst. Econ. Rev. 2022; 19 :497–510. [ Google Scholar ]
- Scheyvens R., Hughes E. Can tourism help to “end poverty in all its forms everywhere”? The challenge of tourism addressing SDG1. J. Sustain. Tour. 2019; 27 :1061–1079. [ Google Scholar ]
- Scott D., Gössling S. Destination net-zero: what does the international energy agency roadmap mean for tourism? J. Sustain. Tour. 2022; 30 :14-14-31. [ Google Scholar ]
- Scott D., Hall C.M., Gössling S. A report on the Paris climate change agreement and its implications for tourism: why we will always have Paris. J. Sustain. Tour. 2016; 24 :933–948. [ Google Scholar ]
- Shehawy Y.M., Abouzied F.Y. The impact of Covid-19 pandemic crisis on tourism industry: current issues in tourism employment. Int. J. Tour. Hospit. Manag. 2022; 5 :106–136. [ Google Scholar ]
- Sigala M. Tourism and Covid-19: impacts and implications for advancing and resetting industry and research. J. Bus. Res. 2020; 117 :312–321. [ PMC free article ] [ PubMed ] [ Google Scholar ]
- Stadler K., Wood R., Bulavskaya T., Södersten C.J., Simas M., Schmidt S., Usubiaga A., Acosta-Fernández J., Kuenen J., Bruckner M., Giljum S., Lutter S., Merciai S., Schmidt J.H., Theurl M.C., Plutzar C., Kastner T., Eisenmenger N., Erb K.H., de Koning A., Tukker A. EXIOBASE 3: developing a time series of detailed environmentally extended multi-regional input-output tables. J. Ind. Ecol. 2018; 22 :502–515. [ Google Scholar ]
- Sun Y.Y. A framework to account for the tourism carbon footprint at island destinations. Tour. Manag. 2014; 45 :16–27. [ Google Scholar ]
- Sun Y.Y., Cadarso M.A., Driml S. Tourism carbon footprint inventories: a review of the environmentally extended input-output approach. Ann. Tour. Res. 2020; 82 [ Google Scholar ]
- Sun Y.Y., Gössling S., Hem L.E., Iversen N.M., Walnum H.J., Scott D., Oklevik O. Can Norway become a net-zero economy under scenarios of tourism growth? J. Clean. Prod. 2022; 363 [ Google Scholar ]
- Sun Y.Y., Lenzen M., Liu B.J. The national tourism carbon emission inventory: its importance, applications and allocation frameworks. J. Sustain. Tour. 2019; 27 :360–379. [ Google Scholar ]
- Tasnim Z., Shareef M.A., Dwivedi Y.K., Kumar U., Kumar V., Malik F.T., Raman R. Tourism sustainability during Covid-19: developing value chain resilience. Oper. Manag. Res. 2022 [ Google Scholar ]
- Tian X.L., Bélaïd F., Ahmad N. Exploring the nexus between tourism development and environmental quality: role of renewable energy consumption and Income. Struct. Change Econ. Dyn. 2021; 56 :53–63. [ PMC free article ] [ PubMed ] [ Google Scholar ]
- UN Proceedings of the UN Climate Change Conference of the Parties (COP26); Glasgow, United Kingdom; 2021. [ Google Scholar ]
- UNWTO . UNWTO; 2019. Tourism Statistics Data. https://www.unwto.org/statistic-data-economic-contribution-of-tourism-and-beyond retrieved from. [ Google Scholar ]
- UNWTO . UNWTO; 2021. UNWTO World Tourism Barometer and Statistical Annex. January 2021. [ Google Scholar ]
- UNWTO, ITF . World Tourism Organization, International Transport Forum; Madrid: 2019. Transport-related CO 2 Emissions of the Tourism Sector. Modelling Results. [ Google Scholar ]
- Vena-Oya J., Castañeda-García J.A., Rodríguez-Molina M.Á. Forecasting a post-Covid-19 economic crisis using fuzzy cognitive maps: a Spanish tourism-sector perspective. Curr. Issues Tour. 2022; 25 :2048–2062. [ Google Scholar ]
- Villacé-Molinero T., Fernández-Muñoz J.J., Orea-Giner A., Fuentes-Moraleda L. Understanding the new post-Covid-19 risk scenario: outlooks and challenges for a new era of tourism. Tour. Manag. 2021; 86 [ PMC free article ] [ PubMed ] [ Google Scholar ]
- Vu H.D., Nguyen A.T.N., Nguyen N.T.P., Tran D.B. Impacts and restoration strategy of the tourism industry post-Covid-19 pandemic: evidence from Vietnam. J. Tour. Futures Ahead-of-print. 2022 [ Google Scholar ]
- Wiedmann T.O., Schandl H., Lenzen M., Moran D., Suh S., West J., Kanemoto K. The material footprint of nations. Proc. Natl. Acad. Sci. 2015; 112 :6271–6276. [ PMC free article ] [ PubMed ] [ Google Scholar ]
- WTTC . World Travel and Tourism Council; London: 2009. Leading the Challenge On Climate Change. [ Google Scholar ]
- WTTC . Proposing a New Target Framework for the Travel & Tourism Sector; London: 2021. A Net Zero Roadmap for Travel & Tourism. https://wttc.org/Portals/0/Documents/Reports/2021/WTTC_Net_Zero_Roadmap.pdf available at. [ Google Scholar ]
- WTTC . WTTC; London: 2021. Travel & Tourism: Economic Impact 2021. https://wttc.org/Portals/0/Documents/Reports/2021/Global%20Economic%20Impact%20and%20Trends%202021.pdf?ver=2021-07-01-114957-177 available at. [ Google Scholar ]
- WTTC, Trip.com Group . WTTC and Trip.com Group; 2021. Trending in travel. Emerging consumer Trends in Travel & Tourism in 2021 and Beyond. [ Google Scholar ]
- Yang Y., Zhang C.X., Rickly J.M. A review of early Covid-19 research in tourism: launching the annals of tourism research's curated collection on coronavirus and tourism1. Ann. Tour. Res. 2021; 91 [ PMC free article ] [ PubMed ] [ Google Scholar ]
- Zha J., Fan R., Yao Y., He L., Meng Y. Framework for accounting for tourism carbon emissions in China: an industrial linkage perspective. Tour. Econ. 2021; 27 :1430–1460. [ Google Scholar ]
- Zopiatis A., Pericleous K., Theofanous Y. Covid-19 and hospitality and tourism research: an integrative review. J. Hospit. Tour. Manag. 2021; 48 :275–279. [ Google Scholar ]
IMAGES
VIDEO
COMMENTS
Apr 16, 2024, 11:28 PM. MADRID - Anti-tourism movements are multiplying in Spain, the world's second most visited country, prompting the authorities to try and reconcile the interests of locals ...
Pre-pandemic, Spain was the second-largest tourism destination in the world, drawing 84 million visitors in 2019 who brought over €92 billion in revenue. 1 Travel and tourism accounted for around 14 percent of Spain's total GDP and provided one in eight jobs. In some communities, tourism contributed to over 20 percent of all economic activity.
Spain received a record number of foreign tourists in 2023, 17% more than the year before and up 1% from the 84 million who came in the pre-pandemic year of 2019, and Tourism Minister Jordi Hereu ...
The COVID-19 pandemic has upset a huge variety of activities and situations worldwide since it first emerged in early 2020. One of the industries most harshly affected by it has been tourism, as a result of restrictions on flights and mobility and people's reluctance to travel for health reasons, all of which have resulted in a significant reduction in tourism in the last two years.
Tourism sector in Spain - statistics & facts. Spain is an established tourism market in Europe - the region with the most tourist arrivals worldwide - and globally. In 2022, Spain registered ...
Planning with a local expert from Elsewhere by Lonely Planet made our family trip to Spain unforgettable. festivals and events. The 9 best food festivals in Spain put travel on the menu. Sep 25, 2023 • 8 min read. Spain is one of the world's top gastronomic playgrounds, and this goes double at festival time.
Valdés said that Spain has already recovered 87 percent of its pre-pandemic international flight reservations and that the islands of Ibiza, Mallorca and Tenerife are already seeing higher tourist numbers than those recorded during the Easter of 2019. Juan Molas, president of the Spanish Tourism Board added during his speech at the II edition ...
Travelling abroad has become more common since an increasing number of individuals, with a lower social and economic status, find travelling abroad viable (Martins et al. 2017).For Europe, this ease led to 710 million international tourist arrivals in 2018 and 744 million in 2019, with $ 570 billion and $ 576 billion in revenues, respectively. . According to the Border Tourist Movement Survey ...
Tourism will be the main catalyst for economic growth this year. Tourism is a significant contributor to Spain's GDP. According to data from the World Travel and Tourism Council (WTTC), for the year 2019, tourism represented 12.4% of Spain's GDP. This includes the direct impact of sectors such as accommodation, catering, transport and tourist ...
Tourism in Spain is a major contributor to national economic life, contributing to about 11.8% of Spain 's GDP (in 2017). [1] Ever since the 1960s and 1970s, the country has been a popular destination for summer holidays, especially with large numbers of tourists from the United Kingdom, Ireland, Turkey, France, Germany, Italy, the Benelux, and ...
Now that pandemic travel restrictions have been lifted, tourism is back with a vengeance - Spain welcomed a record 85.1 million foreign visitors last year. In response, several cities have taken ...
Tourism represents nearly 12% of Spain's economy. But there has been growing pressure by water conservationist groups to limit the use of water by tourists during the drought. According to Barcelona's hotel guild, the average tourist to Barcelona in 2022 used some 163 liters per day, while the figure rose to over 240 liters for luxury ...
In 2020, tourist receipts plummeted due to the COVID-19 pandemic. Of the $79.57 billion billion (2019), only $18.38 billion billion remained. This is a 77 percent decrease in Spain. On average, each of the tourists arriving in 2021 spent about 1,014 US dollars.
In Spain, the drop in non-resident tourist expenditure was 73.9% compared to 47.2% for residents in 2020, resulting in a reversed share of resident and inbound tourism expenditure in total expenditure (from a split 39-61% domestic vs. inbound tourism, quite stable in the previous years, to 57-43% in 2020 (INE, 2022d)).
Spain has impressive tourist attractions that are outstanding on the natural and cultural tourism dimensions. The purpose of this paper is to identify traits of the most attractive destinations in Spain and to understand the relative importance of natural, cultural, and dual (natural and cultural) attractions to target consumers.,The authors ...
Tourism is one of the fastest-growing economic sectors. This has piqued increasing interest in the evaluation of the performance of the sector. This paper joins this line of research by providing a potential framework for measuring efficiency in the context of a country such as Spain, where sun-and-sand tourism, usually associated with mass tourism, predominates. Tourist areas located on the ...
Now that pandemic travel restrictions have been lifted, tourism is back with a vengeance -- Spain welcomed a record 85.1 million foreign visitors last year. In response, several cities have taken ...
In terms of tourism revenue, Spain generated over 92 billion euros in 2019, which represented an increase of 2.8% from the previous year. Tourism accounted for 11.7% of Spain's GDP in 2019, making it a key contributor to the country's economy. Accommodation is a significant part of the tourism industry in Spain.
In this article, we examine the statistical properties of the time series corresponding to the number of national and international visitors in Spain using fractional integration. This methodology allows us to examine the degree of persistence of the series, and thus, infer some conclusions about the nature of the shocks.
The subject of this article is hiking tourism in Spain, a tourist and leisure activity conducted on foot along signposted, preferably historical, paths, that run through natural/rural countryside. This open-air, outdoor activity is amongst the most demanded by the tourists and day-trippers who visit mountain areas and protected natural spaces ...
It predicted tourism earnings will reach 202.65 billion euros ($215.4 billion) this year, an 8.6 percent increase over the record set in 2023 which had already seen "a spectacular rate of growth ...
In this article, we will explore why tourism is such an essential industry in Spain. Spain's Tourism Industry. Spain has a prosperous tourism industry that contributes significantly to its economy. According to the World Tourism Organization (UNWTO), Spain was the second most visited country in the world in 2019, with over 83 million ...
These results coincide with some studies focused on mass tourism in Spain (Baidal et al. 2013; Claver et al. 2007). The study developed provides a starting point for the analysis of factors that cause the observed differences in efficiency. The lack of information in the territorial units considered prevents the analysis of other determinants ...
1 There are many general or local studies on the tourism of this period in Spain, but generally speaking we do not have access to references that adequately explain its economic aspect for the whole period, with some exceptions, such as Rafael Esteve and Rafael Fuentes, Economía, historia e instituciones del turismo en España (Madrid: Pirámide, 2000), 15-50.
Now that pandemic travel restrictions have been lifted, tourism is back with a vengeance -- Spain welcomed a record 85.1 million foreign visitors last year. In response, several cities have taken ...
The closure of the campsite, which offered tents for 12 euros ($13.03) a night, is a foretaste of a new hard line towards illegal short-lets on Spain's Canary Islands, where listings on platforms ...
Results show that the carbon footprint of tourism in Spain fell by 63% in 2020 compared to pre-pandemic levels, which would be aligned with the current sectoral decarbonisation target. However, the new tourists' consumption patterns resulting from the pandemic are insufficient to increase tourism sustainability if they imply pre-pandemic ...
A major spoiler is weather, which will be a big variable in the 2026 eclipse — one Greenland, Iceland and Spain will see. "Iceland normally has a lot of cloud during that time of year," said ...
Anti-tourism movements are multiplying in Spain, the world's second most visited country, prompting authorities to try and reconcile the interests of locals and the lucrative sector.- 'Social ...
Ballard added that the next solar eclipse, which will pass through Iceland, Greenland, and Spain on August 12, 2026, could result in similar tourism and revenue influxes. And if travelers are ...