
Quick Facts & Figures
Tourism by the numbers.
Key tourism stats for year to March 2022
Total tourism:
- total tourism expenditure was $26.5 billion, an increase of 2.7 percent ($704 million) from the previous year
- tourism generated a direct contribution to GDP of $10 billion, or 3 percent of GDP, an increase of 1.3 percent ($132 million)
- international tourism expenditure increased 30.6 percent ($455 million) to $1.9 billion
Domestic tourism:
- domestic tourism expenditure increased 1 percent ($249 million) to $24.6 billion
- household tourism expenditure decreased 1.7 percent ($344 million)
- business and government increased 14.2 percent ($593 million)
International tourism:
- overseas visitor arrivals to New Zealand increased 335.3 percent to 229,370
- international student expenditure (studying less than 12 months) was $184 million, an increase of 135.7 percent ($106 million)
- international tourism’s overall contribution to New Zealand’s total exports of goods and services was 2.4 percent, an increase of 0.4 percentage points
- GST generated from international tourists totalled $209 million, an increase of $72 million
Employment:
- the indirect value added of industries supporting tourism generated an additional $6.6 billion, or 2 percent of GDP
- the number of tourism employees was 125,622 – an increase of 3.2 percent (3,888)
- the number of tourism working proprietors was 19,413 – a decrease of 1.4 percent (267)
- as a share of the total number of people employed in New Zealand, direct tourism employment was 5.2 percent.
Source: Tourism Satellite Account - Year Ended March 2022
Prior to the COVID-19 pandemic, tourism made a huge contribution to the New Zealand economy
- Total annual tourism expenditure was $41.9 billion – $ 115 million per day.
- Annual international tourism expenditure was $17.5 billion – $ 48 million per day.
- Annual domestic tourism expenditure was $24.4 billion – $ 67 million per day.
- Total annual tourism expenditure had increased by almost $15 billion, or 55%, in the past seven years.
- Tourism was New Zealand’s biggest export industry, contributing 20.1% of total exports.
- Tourism generated a direct annual contribution to GDP of $16.4 billion, or 5.5%, and a further indirect contribution of $11.3 billion, another 3.8% of New Zealand’s total GDP.
- 225,384 people are directly and another 158,802 indirectly employed in tourism in New Zealand – 13.6% of the total number of people employed in New Zealand.
- The annual GST paid by tourists is $3.9 billion, including $1.8 billion collected from international visitors.
Source: Statistics NZ Tourism Satellite Account year ended March 2019 (issued December 2020).
Other Data Sources
International Travel , Stats NZ
Monthly international travel updates cover the number and characteristics of overseas visitors, and New Zealand resident travellers (short-term movements) entering or leaving New Zealand.
International Visitor Survey (IVS), MBIE
Estimated annual spend by market, survey based, released quarterly. Does not include Air New Zealand fares or short stay students. Estimates by market can fluctuate significantly from quarter to quarter.
Monthly Regional Tourism Estimates ( MRTEs), MBIE
Estimated regional spend by domestic and international markets, electronic transactions based, released monthly. Does not include Air New Zealand fares and other spending captured in the Tourism Satellite Account . Monthly estimates by region can fluctuate; annual estimates have a higher degree of certainty.
Accommodation Data Programme , MBIE
The Accommodation Data Programme (ADP) provides information about short-term accommodation activity at national, regional and lower levels. It estimates the guest nights, occupancy rates and other measures relating to the accommodation industry.
Thanks to our strategic partners

New Zealand Tourist Arrivals
The number of visitor arrivals in new zealand increased by 35% year-on-year to 362,836 in february 2024. the largest changes were seen in arrivals from china (up 33,677 to 37,891), the united states (up 15,622 to 55,517), australia (up 10,685 to 107,857), korea (up 4,284 to 9,548), and japan (up 3,242 to 8,542). the february 2024 arrivals were 87% of the pre-covid-19 level of 417,934 in february 2019. of the 362,836 overseas visitor arrivals in february 2024, 30% were from australia (compared with 30% in february 2019), 15% were from the united states (12% in february 2019), 10% were from china (12% in february 2019), and 8% were from the united kingdom (9% in february 2019). source: statistics new zealand, tourist arrivals in new zealand increased to 362836 in february from 326427 in january of 2024. tourist arrivals in new zealand averaged 68224.28 from 1921 until 2024, reaching an all time high of 529255.00 in december of 2018 and a record low of 40.00 in april of 1942. this page provides the latest reported value for - new zealand tourist arrivals - plus previous releases, historical high and low, short-term forecast and long-term prediction, economic calendar, survey consensus and news. new zealand tourist arrivals - data, historical chart, forecasts and calendar of releases - was last updated on may of 2024., tourist arrivals in new zealand increased to 362836 in february from 326427 in january of 2024. tourist arrivals in new zealand is expected to be 215900.00 by the end of this quarter, according to trading economics global macro models and analysts expectations. in the long-term, the new zealand tourist arrivals is projected to trend around 596000.00 in 2025 and 615000.00 in 2026, according to our econometric models., markets, gdp, labour, prices, money, trade, government, business, consumer, housing, taxes, health, climate.
New Zealand Tourism Statistics
Page last updated: 27th February 2023
Table of Contents
How many tourists visit New Zealand each year?
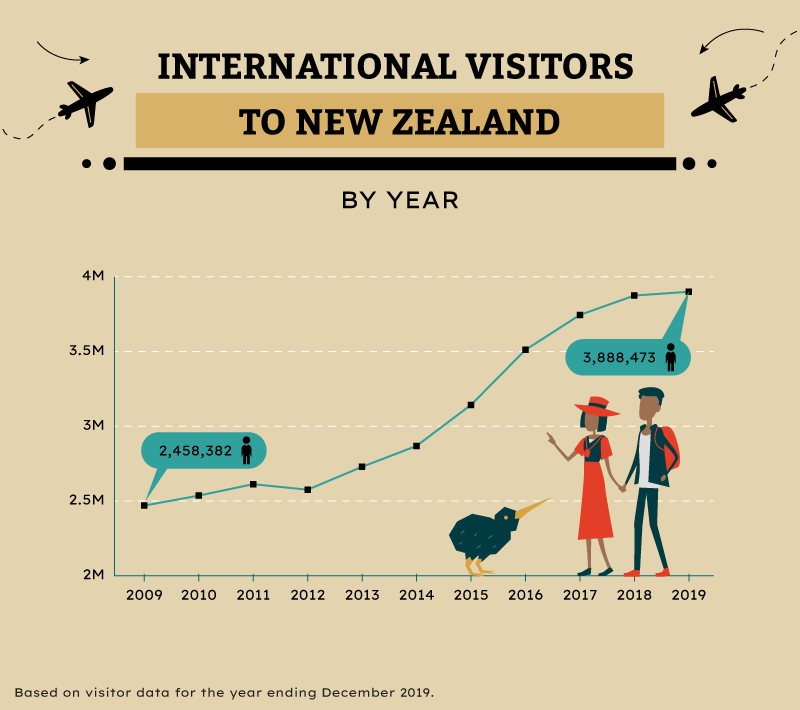
- Visitors to New Zealand were down 74.4% when compared with the 3.8 million of the previous year (ending December 2019)
- This dramatic decrease was due to the coronavirus pandemic and related travel restrictions
How many tourists visited New Zealand in 2022?
Over 1.4 million tourists and other visitors travelled to New Zealand in 2022 (year ending December 2022).
- International visitors increased by 590% when compared with the over 206 thousand of the previous year (year ending December 2021)
- In February 2022, New Zealand began a gradual reopening of its borders, with full restrictions lifted in July 2022
- While numbers have risen, visitors are still relatively low when compared with the over 3.8 million who visited in 2019 (year ending December 2019)
Who visited New Zealand in 2022
- The top five sources of visitors to New Zealand in 2022 were: Australia, the USA, the UK, Singapore, and Canada
- While previously sitting in the number 2 spot, visitors from china saw a dramatic decrease, with only 16,896 visiting during 2022
How much did international tourists spend in New Zealand in 2022?
Complete data for 2022 has yet to be made available. International tourists spent over $1.9 billion during trips to New Zealand in 2021/2022 (year ending march 2022).
- Spending was up 30.6% when compared with the over $1.3 billion spent the previous year (year ending march 2021)
- Spending is down 89% when compared with the over 17.6 billion spent for the year ending March 2020
How many tourists visited New Zealand in 2019?
- International tourism saw an increase of 0.7% over the previous year.
New Zealand Tourism Statistics 2020
Who visited new zealand in 2020.
- Visitors from Australia were down 22.6% when compared to the previous year
- The top three countries visitors to NZ came from were Australia, USA and China
- Visitors from China were down 41% when compared to the previous year
January 2020
- In January 2020 approximately 410,778 international visitors travelled to New Zealand.
- Visitors in January were up 2.9% when compared with the 399,346 of January 2019.
February 2020 and the Impact of Coronavirus
- In February 2020 approximately 372,745 international visitors travelled to New Zealand.
- International visitors were down 10.8% when compared to 417,934 visitors in 2019.
- Tourism from Asia was Significantly affected with a 44.6% decrease in visitors arriving from Asian countries.
March 2020 and Further Travel Restrictions
- On March 19th 2020, New Zealand closed its borders to almost all international travel.
- On March 25th New Zealand declared a state of emergency and entered level 4 lockdown restrictions, further restricting travel.
- International arrivals to New Zealand were down 53.6% when compared with March 2019 (with 175,521 in March 2020 and 378,270 in March 2019).
Impact of the Travel Ban on Chinese Visitors
- In February 2020 visitors arriving from China decreased by 90.2% compared to the previous year (5004 arrivals in February 2020 vs 50,861 visitors in February 2019).
- The significant drop was the result of a coronavirus-related travel ban implemented by the New Zealand government on 2 February for people travelling from mainland China.
- January/February is typically the peak travel period for Chinese visitors to NZ.
New Zealand Inbound Travel Statistics for 2019
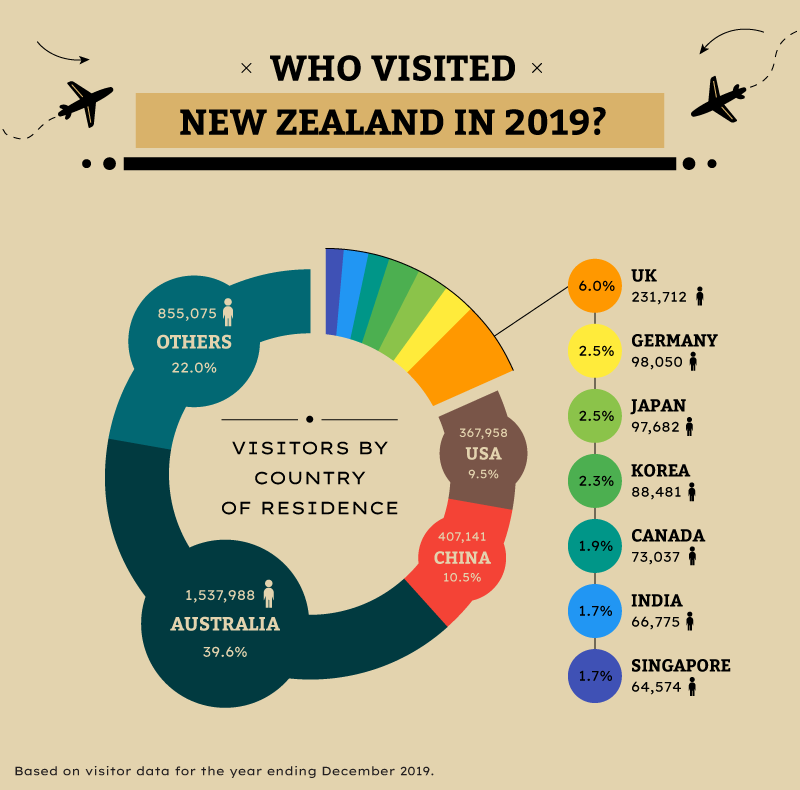
Who visited new zealand in 2019.
- The highest number of visitors came from Australia at over 1.5m.
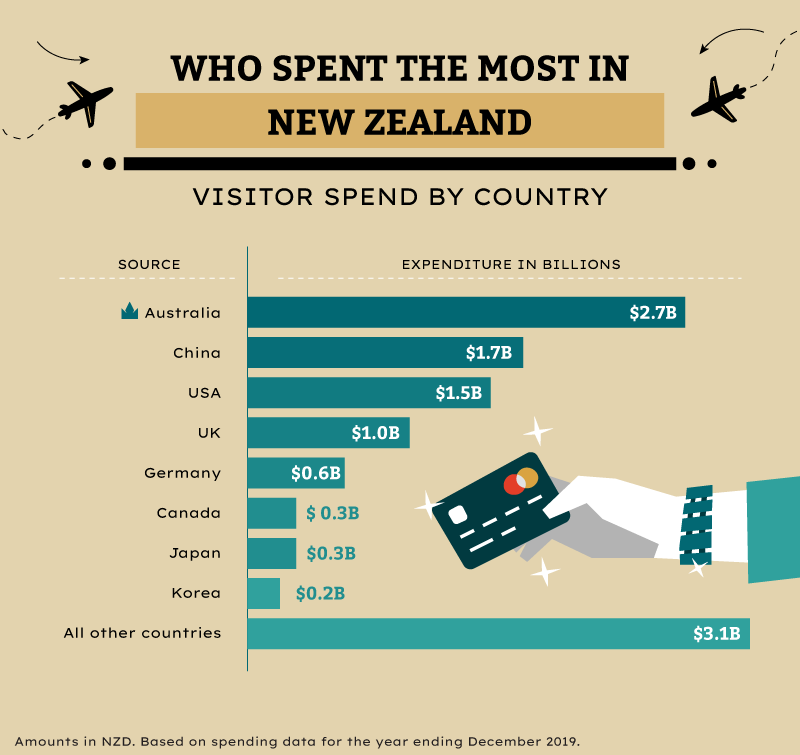
How much did international tourists spend in New Zealand in 2019?
- International visitors spent over $11.4B in the year ending december 2019. 2
- Australians were the top spenders at over $2.7B alone.
How many tourists visit Auckland each Year?
- Over 2,113,143 tourists and other travellers visited Auckland in the year ending December 2018. 3
How many tourists visit Wellington each year?
- Over 761,203 tourists and other travellers visited wellington in the year ending December 2018.
How many tourists visit Queenstown each year?
- Over 1,306,572 tourists and other travellers visited Queenstown in the year ending December 2018.
How many tourists visit Christchurch each year?
- 1,073,699 tourists and other travellers visited wellington in the year ending December 2018.
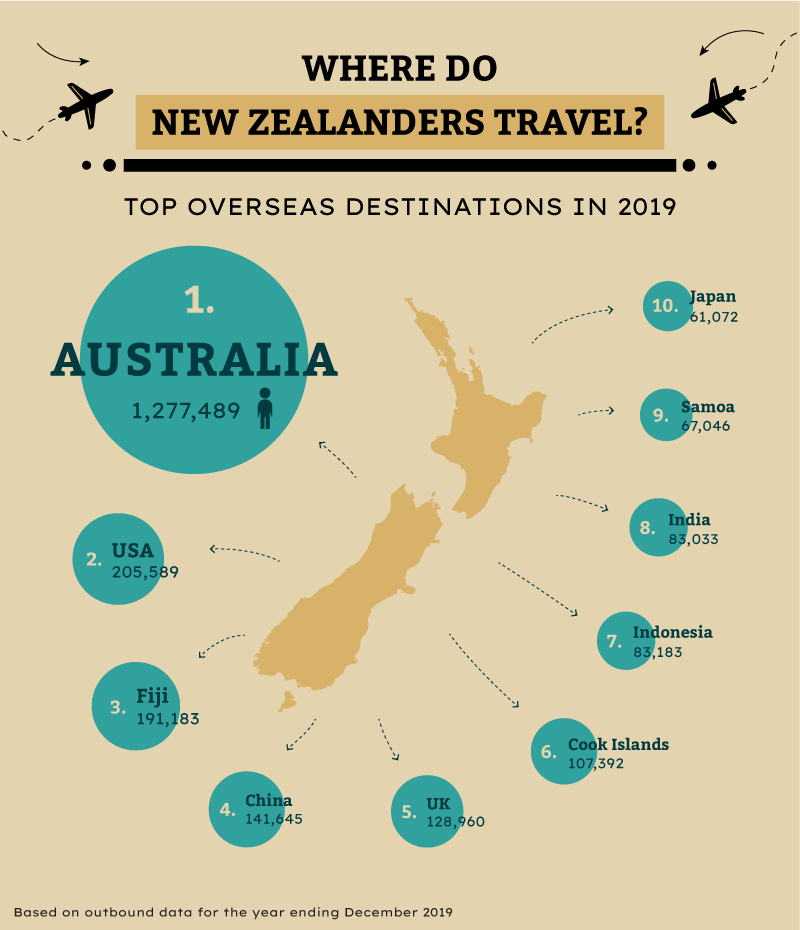
New Zealand Outbound Tourism Statistics for 2019
Where did new zealanders visit in 2019.
- New Zealanders made over 3.1M international trips in the year ending December 2019. 4
- Australia was the top destination for New Zealand tourists by a wide margin.
Travel Statistics Resources
Global statistics.
- Brisbane Statistics
- Gold Coast Statistics
- Melbourne Statistics
- Perth Statistics
- Sydney Statistics
- Tasmania Statistics
- Stats NZ : International Travel December 2022 ↩
- MBIE : International Visitor Survey ↩
- Stats NZ : International Travel December 2019
Tourism research and data
We collect, analyse and publish New Zealand tourism data, along with a range of useful tools and publications.
Tourism data overview
Together with Stats NZ and other organisations, we produce a range of data about the tourism industry.
- Tourism Data Leadership Group
- The Tourism Information and Data Hui
- 2018 Tourism Data Domain Plan
- Tourism data sources diagram
- Data release calendar
- Quarterly Tourism Report
Tourism Evidence and Insights Centre
Visit the Tourism Evidence and Insights Centre to access tourism data, research and reports from a wide range of sources.
Tourism data releases
This section includes the Tourism Electronic Card Transactions (TECTs), Accommodation Data Programme (ADP), International Visitor Survey (IVS), Tourism Satellite Account (TSA), and data on international travel and cruise visitor spending in New Zealand.
- Monthly unique regional population estimates (MURPEs)
- Tourism Electronic Card Transactions (TECTs)
- Accommodation Data Programme (ADP)
- International Visitor Survey (IVS)
- Tourism and the economy
- International travel
- Tourism employment earnings and filled jobs
- Cruise data
- Monthly Regional Tourism Estimates (MRTEs, 2016-2020)
- Business Events Research Programme (2009-2019)
- Domestic Travel Survey 1999–2012
Tourism data insights
Access a range of tourism research and reports commissioned or undertaken in recent years.
- Tourism Insight Series
- Tourism sector report
- Kaikōura report
- Tourism Flows Model
- Understanding variation in tourism spend
International tourism forecasts
Pre-COVID-19 our tourism forecasts provided expectations on the future tourism demand in New Zealand. Please bear this in mind when using this information.
- 2019-2025 international tourism forecasts
- Market forecast summaries
- About the tourism forecasts
- International forecast microdata
- Previous international tourism forecasts
Subscribe to tourism data alerts
Join our mailing list to receive our latest tourism data.
© Ministry of Business, Innovation and Employment
https://www.mbie.govt.nz/immigration-and-tourism/tourism-research-and-data/ Please note: This content will change over time and can go out of date.
Consumer research
Uncover visitor motivations and barriers to travel, key demographics and more., international markets.
International visitation plays an important role in New Zealand’s tourism economy.

Omarama, Canterbury
By Miles Holden

Active Considerer reports
Analysis on the size of Tourism New Zealand’s target audience in various markets, and their sentiment towards travelling to New Zealand. Australia (opens in new window) , Americas (USA and Canada) (opens in new window) , Asia (China and Japan) (opens in new window) , Asia (India, South Korea and Singapore) (opens in new window) , Europe (UK and Germany) (opens in new window) , Archives

Active Considerer Intentions to Travel reports
The Intentions to Travel Market Deep Dive 2023 report (opens in new window) are based on qualitative in-depth interviews. The output of this research distils the claimed experiences of consumers from 10 markets.

The role of sustainability in destination and operator choice
The role of sustainability in destination and operator choice research (opens in new window) was undertaken by Tourism New Zealand and the Ministry of Business Innovation and Employment to better understand visitor perceptions of sustainability in relation to holiday destination and operator choice.
Let us show you the best of New Zealand on other platforms by selecting 'On' and allowing us to share data from your visit(s) with our partners.
Our Privacy Policy and Cookie Policy explain how we use your data and who our partners are.
Your current setting:
In addition to above, we use other cookies and analytics to provide a better site experience. To view cookie details and how to opt-out, please see our Cookie Policy
We use cookies to provide you with a better experience on this site. Keep browsing if you're happy with this.
We also use cookies to show you the best of New Zealand on other platforms. See our Privacy Policy and Cookie Policy to understand how you can manage cookies.

What are you looking for?
56+ new zealand travel & tourism statistics [fresh for 2024].
It’s no doubt that New Zealand is among the most beautiful places for travel .
With rolling landscapes and incredible countryside, it’s also known for being the filming location for the world-famous Lord of the Rings franchise.
However, did you know that most of New Zealand’s tourists are from Australia?
Or that the average visitor spends 13.1 days in the country?
Whether you want to learn more about tourism in New Zealand or planning a trip there, we’ve compiled a list of the latest statistics about its travel industry.
Let’s get started!
Sources : We’ve includes the source of every statistic under each of them, or you can head to the bottom of this post for the full list of references and articles.
Travellerspoint
How many tourists visit New Zealand each year?
- International visitor arrivals in 2023 in New Zealand are expected to reach 4.9 million.
What percentage of New Zealand is tourism?
Before the pandemic, tourism was the largest export industry in New Zealand, contributing 20.1% of total exports.
Which country visits New Zealand the most?
The country that sends the most international tourists to New Zealand is Australia, with 467 thousand arrivals in 2022.
New Zealand Travel & Tourism at a Glance
- The top reason for visiting New Zealand was to visit friends or relatives (300 thousand people) visiting for this purpose.
- Australia provided over 1.5 million visitors to New Zealand in 2017, and this is set to grow by 23% by 2024.
- A survey conducted in Q4 2022 showed that 70% of respondents in New Zealand planned to go on a domestic holiday in the next 12 months.
- Before the pandemic, tourism was the largest export industry in New Zealand, contributing 20.1% of total exports.
- In 2022, international tourists spent around NZ$1.9 billion, or a slight increase from 2021.
- According to IBIS World, there are 579 hotels and resorts in New Zealand, with the market being worth $2 billion.
- The most visited city for international tourists in New Zealand is Auckland. It received 448 thousand visitors in 2022.
- As of April 2023, the annual number of business travellers in New Zealand was 164 thousand.
New Zealand inbound tourism statistics
1. international visitor arrivals in 2023 in new zealand are expected to reach 4.9 million..

2. This figure is expected to grow 4.6% a year, reaching 5.1 million visitors in 2024.
3. in january 2023, there were over 265 thousand international visitors to new zealand, a huge rise from the 4,033 arrivals in january 2022..
The dramatic rise is because of the fact that New Zealand had re-opened its borders after a two-year pandemic lockout.

4. The annual number of international arrivals in New Zealand grew by 230% in 2022.
5. the top reason for visiting new zealand was to visit friends or relatives (300 thousand people) visiting for this purpose., new zealand tourists by country, 6. in 2022, the largest group of international visitors to new zealand came from the oceania region (500 thousand people)., 7. the country that sends the most international tourists to new zealand is australia, with 467 thousand arrivals in 2022., 8. australia provided over 1.5 million visitors to new zealand in 2017, and this is set to grow by 23% by 2024., 9. based on visa type, the largest number of arrivals in new zealand in 2022 was by an australian visa, with more than 124 thousand entries..
On the other hand, the smallest category of arrivals was by a diplomatic visa, with just 725 recorded entries.
10. There were 250 thousand British visitors to New Zealand in 2017, and is expected to grow 2.5% annually to reach 298 thousand by 2024.
By 2024, there is expected to be an annual figure of 298 thousand arrivals from the UK .
11. Visitor growth from Canada was strong in 2017, at 12.7%. Looking forward, it’s expected to reach 92 thousand annual arrivals by 2024.
The Ministry of Business, Innovation, and Employment of New Zealand expects Canadian arrivals to hit 92 thousand in 2024 .
12. Moreover, growth in American visitor arrivals is expected to be strong for the next couple of years at 6.5% per annum.
The US is expected to contribute a total of 516 thousand visitor arrivals in 2024 .
The state with the largest share of US visitors to New Zealand is California, with over 75 thousand annual arrivals .
Domestic tourism in New Zealand
How much does NZ spend on domestic tourism?
13. A survey conducted in Q4 2022 showed that 70% of respondents in New Zealand planned to go on a domestic holiday in the next 12 months.
14. the majority of domestic overnight leisure trips were two or three nights in length (28% reported going on a 2-night trip)..
Trips longer than seven nights were picked by 15% of respondents.
15. The most common reason for going on a domestic overnight trip is holidaymaking (50%).
16. as at october 2022, domestic tourism electronic card transaction expenditure was highest in auckland, at nz$2 billion. , the economic impact of tourism on new zealand economy, 17. before the pandemic, tourism was the largest export industry in new zealand, contributing 20.1% of total exports. , 18. in 2022, international tourists spent around nz$1.9 billion, or a slight increase from 2021., 19. meanwhile, domestic tourism expenditure in that year was much higher at nz$24.5 billion..

20. The total annual tourism expenditure had steadily increased by almost $15 billion, or 55%, in the past seven years before the pandemic.
21. international and domestic tourists spent nz$6.28 billion on retail products and nz$2.7 billion on food and beverage services in 2022., 22. in 2022, more than nz$470 million was spent in international tourism electronic card transaction expenditure in auckland., 23. the total value added by direct and indirect tourism expenditure in new zealand amounted to nz$8.5 billion in 2021, a decrease from nz$27 billion in 2020..
The pandemic has left its economic consequence on the tourism industry in New Zealand, causing the total value added to drop from NZ$27 billion to NZ$8.5 billion within one year.
24. In terms of GDP, the country’s tourism industry gross domestic product fell by 46% in 2021.
25. in 2022, the tourism sector contributed 5.1% of new zealand’s total gdp., 26. china is anticipated to become new zealand’s biggest tourism market by spending, reaching $3.1 billion annual expenditure by 2024, compared to just $3 billion by australian visitors., 27. household tourism expenditure fell by 1.7% ($344 million) from march 2021 to march 2022., 28. at the same time, business and government tourism expenditure increased by 14.2%, or $593 million., 29. in 2022, there were 240 thousand people employed in the tourism industry in new zealand. this is an increase from the 234 thousand employees in the sector in 2021., 30. hotels and resorts throughout new zealand employ a total of 10,342 people..
[IBIS World]
Travel accommodation in New Zealand
How many hotel are there in New Zealand?
31. According to IBIS World, there are 579 hotels and resorts in New Zealand, with the market being worth $2 billion.
32. the hotel and resort industry revenue is anticipated to fall by an annualised 3.7% to $1.6 billion between 2018 and 2023, largely due to the pandemic in 2021. this figure includes a significant recovery of 37.4% in 2022 to 2023., 33. the leading accommodation type in new zealand in 2022 for international guests was hotels, which welcomed more than 1 million guests that year..
Hotels are the most preferred type of accommodation for travellers in New Zealand, receiving over 1 million nights in 2022 .
34. The second most popular type of accommodation for foreign tourists in New Zealand are backpackers and large motels/apartments, each of which received 560 thousand nights.
Backpackers’ accommodation are also very popular among visitors to New Zealand, with this type of lodging recording 560 thousand nights in 2022 alone.
35. Meanwhile, lodges and boutique accommodations had only around 123 thousand international guest nights in 2022.

36. Hotels are also the favored type of travel accommodation for domestic visitors, with 7.4 million domestic nights recorded in 2022.
37. domestic tourists enjoy camping in rvs, as shown by the 7.2 million domestic nights spent in holiday parks and camping grounds in new zealand in 2022., 38. in comparison, international tourists spent a total of 320 thousand nights in holiday parks and camping grounds. .
Renting an RV in New Zealand has become a popular way of travelling for domestic and international travellers alike.
39. In 2022, there were more than 24 thousand business entities in the hospitality industry in New Zealand.
This has been a consistent growth since 2013, when there were only 18.57 thousand hospitality enterprises.

40. In 2022, hotels in the city of Wellington had the highest occupancy rate, at 59%, while in Christchurch it was 53%.
New Zealand experienced a fall in hotel occupancy from 2021 to 2022.

41. As of June 2023, there are a total of 10,462 properties in New Zealand on Booking.com
[Booking.com]
Booking.com is the world’s most visited travel and tourism website, and there are currently 10,462 listings there of New Zealand accommodations.
Most visited destinations in New Zealand
What is the most visited city in New Zealand?
42. The most visited city for international tourists in New Zealand is Auckland. It received 448 thousand visitors in 2022.
Auckland is a particularly popular place for RV trips, which is why renting a campervan there is very easy.
43. Queenstown is the next most popular destination with just over a million international visitors in 2019.
In comparison, Auckland welcomed 1.83 million visitors in 2019.
44. Auckland is the top destination for domestic travelers, with 19% of respondents having visited it during their last overnight trip.
Wellington, Taupo, and Christchurch were also among the top domestic destinations for overnight tourist visits.
45. In 2019, the average daily rate for a hotel room in Queenstown was NZ$249, making it the most expensive town to stay in when in New Zealand.
Auckland comes second at NZ$202 per night.
46. In March 2023, Christchurch received 12,490 visitors, an increase of 7% on the prior month, and an increase of 160% on March 2022.
[Christchurch NZ]
Christchurch is a well-known place among tourists in New Zealand, welcoming 12,490 visitors in March 2023 alone. It offers many activities and epic road trip routes, hence the popularity of renting an RV or campervan in Christchurch .
Tourism behaviour in New Zealand
What is the trend in tourism in New Zealand?
47. In the 2022-2023 period, the average holidaymaker in New Zealand stays for 15.42 days, an increase from the average length of 13.1 days in 2019-2020.
48. visitors who are visiting friends and family in new zealand tend to stay for longer, at an average of 21.45 days., 49. on average, australian tourists in new zealand will stay for 12.52 days., 50. however, tourists from other parts of the world tend to stay for longer, at around 24.25 days per visit., 51. as of april 2023, the annual number of business travellers in new zealand was 164 thousand..
New Zealand receives around 164 thousand business travellers per year.
52. New Zealand ranks as the second most peaceful country in the world after Iceland, making it an ideal destination for female and solo travellers.
New Zealand attracts many solo travellers , thanks to its reputation as the second most peaceful country worldwide.

53. By 2015, 80% of internet users claimed that they book travel online in New Zealand.
Around 4 in 5 people who use the internet in 2015 said that they book their travels online.
Work and study abroad statistics in New Zealand
How many international students are studying in New Zealand?
54. In 2022, 39 thousands student visas were granted in New Zealand, decreasing from 52 thousand in 2021.
55. meanwhile, 173 thousand work visas were granted in 2022, rising from 152 thousand in the previous year., 56. 70% of working holiday visa holders in new zealand said they wanted to visit auckland during their time in the country..
This was based on a survey conducted in 2022 among people with a working holiday visa in New Zealand.
57. The second most popular destination among working holiday visa holders was Wellington, with 1 in 2 people wanting to visit the capital city.
That’s all for our New Zealand travel and tourism statistics!
Hopefully, this has helped you understand more about this beautiful country.
Can you think of anything important that we missed?
Don’t hesitate from commenting below!
You may also want to check out these other travel statistics:
- Mexico Travel & Tourism Statistics
- Peru Travel & Tourism Statistics
- Italy Travel & Tourism Statistics
- Christchurch NZ
- Booking.com

Leave a comment
Let us know what you think.

5 million people can't be wrong
Travel, Tourism & Hospitality
Industry-specific and extensively researched technical data (partially from exclusive partnerships). A paid subscription is required for full access.
- Total tourism expenditure New Zealand 2022-2023, by product type
Total tourism expenditure in New Zealand from 2022 to 2023, by product type (in billion New Zealand dollars)
- Immediate access to 1m+ statistics
- Incl. source references
- Download as PNG, PDF, XLS, PPT
Additional Information
Show sources information Show publisher information Use Ask Statista Research Service
February 2024
New Zealand
2022 to 2023
years ended March
*Values are provisional. Values have been rounded. Refers to expenditure of domestic and international tourists. One New Zealand dollar is equal to approximately 0.61 U.S. dollars and 0.56 euros (as of February 2024). Note: Stats NZ and licensed by Stats NZ for re-use under the Creative Commons Attribution 4.0 International license.
Other statistics on the topic Travel and tourism in New Zealand
- Monthly number of international visitor arrivals to New Zealand 2019-2023
- Annual number of international visitor arrivals to Auckland New Zealand FY 2020-2023
- Perceived negative impacts of tourism on the environment New Zealand 2023
- Number of international visitor arrivals to New Zealand FY 2023, by country of origin
To download this statistic in XLS format you need a Statista Account
To download this statistic in PNG format you need a Statista Account
To download this statistic in PDF format you need a Statista Account
To download this statistic in PPT format you need a Statista Account
As a Premium user you get access to the detailed source references and background information about this statistic.
As a Premium user you get access to background information and details about the release of this statistic.
As soon as this statistic is updated, you will immediately be notified via e-mail.
… to incorporate the statistic into your presentation at any time.
You need at least a Starter Account to use this feature.
- Immediate access to statistics, forecasts & reports
- Usage and publication rights
- Download in various formats
You only have access to basic statistics. This statistic is not included in your account.
- Instant access to 1m statistics
- Download in XLS, PDF & PNG format
- Detailed references
Business Solutions including all features.
Statistics on " Travel and tourism in New Zealand "
- Tourism value added as a share of industry GDP New Zealand 2014-2023
- Tourism GDP growth rate New Zealand 2014-2023
- Total tourism expenditure New Zealand 2014-2023, by tourist type
- Total number of people employed in the tourism sector New Zealand 2014-2023
- Annual number of international visitor arrivals to New Zealand FY 2014-2023
- Annual growth of international visitor arrivals to New Zealand FY 2014-2023
- Number of international visitor arrivals to New Zealand FY 2023, by region of origin
- Number of international visitor arrivals to New Zealand FY 2023, by port of entry
- Number of international visitor arrivals to New Zealand FY 2023, by age
- Number of international visitor arrivals to New Zealand FY 2023, by purpose of visit
- Annual number of outbound NZ resident travelers New Zealand FY 2014-2023
- Number of inbound NZ resident arrivals New Zealand FY 2023, by country visited
- Leading tourism experience interests among outbound travelers New Zealand 2022
- Leading sport tourism experience interests of outbound travelers New Zealand 2022
- Leading wilderness tourism interests of outbound travelers New Zealand 2022
- Monthly number of international visitor arrivals to Auckland New Zealand 2019-2024
- Number of international visitor arrivals to Auckland, NZ FY 2023, by country origin
- Share of domestic overnight leisure trips New Zealand 2022, by region
- Top attractions visited by domestic tourists Central Auckland New Zealand FY 2022
- Top attractions visited by domestic tourists South Auckland New Zealand FY 2022
- Top attractions visited by domestic tourists North Auckland New Zealand FY 2022
- Views on the impact of international and domestic tourism on New Zealand 2023
- Views on international tourism impact on post-pandemic economic recovery NZ 2023
- Perceived positive impacts of tourism on the economy and society New Zealand 2023
- Views on the environmental impact of international tourism New Zealand 2023
- Views on the social well-being impact of international tourism New Zealand 2023
- Views on the impact of international tourism on culture, values, and heritage NZ 2023
Other statistics that may interest you Travel and tourism in New Zealand
- Premium Statistic Tourism value added as a share of industry GDP New Zealand 2014-2023
- Premium Statistic Tourism GDP growth rate New Zealand 2014-2023
- Premium Statistic Total tourism expenditure New Zealand 2014-2023, by tourist type
- Premium Statistic Total tourism expenditure New Zealand 2022-2023, by product type
- Premium Statistic Total number of people employed in the tourism sector New Zealand 2014-2023
International tourism
- Premium Statistic Monthly number of international visitor arrivals to New Zealand 2019-2023
- Premium Statistic Annual number of international visitor arrivals to New Zealand FY 2014-2023
- Premium Statistic Annual growth of international visitor arrivals to New Zealand FY 2014-2023
- Premium Statistic Number of international visitor arrivals to New Zealand FY 2023, by region of origin
- Premium Statistic Number of international visitor arrivals to New Zealand FY 2023, by country of origin
- Premium Statistic Number of international visitor arrivals to New Zealand FY 2023, by port of entry
- Premium Statistic Number of international visitor arrivals to New Zealand FY 2023, by age
- Premium Statistic Number of international visitor arrivals to New Zealand FY 2023, by purpose of visit
Outbound tourism
- Premium Statistic Annual number of outbound NZ resident travelers New Zealand FY 2014-2023
- Premium Statistic Number of inbound NZ resident arrivals New Zealand FY 2023, by country visited
- Premium Statistic Leading tourism experience interests among outbound travelers New Zealand 2022
- Premium Statistic Leading sport tourism experience interests of outbound travelers New Zealand 2022
- Premium Statistic Leading wilderness tourism interests of outbound travelers New Zealand 2022
Tourism in Auckland
- Premium Statistic Monthly number of international visitor arrivals to Auckland New Zealand 2019-2024
- Premium Statistic Annual number of international visitor arrivals to Auckland New Zealand FY 2020-2023
- Premium Statistic Number of international visitor arrivals to Auckland, NZ FY 2023, by country origin
- Premium Statistic Share of domestic overnight leisure trips New Zealand 2022, by region
- Premium Statistic Top attractions visited by domestic tourists Central Auckland New Zealand FY 2022
- Premium Statistic Top attractions visited by domestic tourists South Auckland New Zealand FY 2022
- Premium Statistic Top attractions visited by domestic tourists North Auckland New Zealand FY 2022
Views on tourism
- Premium Statistic Views on the impact of international and domestic tourism on New Zealand 2023
- Premium Statistic Views on international tourism impact on post-pandemic economic recovery NZ 2023
- Premium Statistic Perceived positive impacts of tourism on the economy and society New Zealand 2023
- Premium Statistic Views on the environmental impact of international tourism New Zealand 2023
- Premium Statistic Perceived negative impacts of tourism on the environment New Zealand 2023
- Premium Statistic Views on the social well-being impact of international tourism New Zealand 2023
- Premium Statistic Views on the impact of international tourism on culture, values, and heritage NZ 2023
Further Content: You might find this interesting as well
IMAGES
COMMENTS
Tourism. Tourism statistics give you information about the tourism industry in New Zealand. Find information about: arrivals and departures by overseas visitors and New Zealand residents. Number Months before March 2020 are no longer revised for seasonally adjusted series. Months from March 2020 to December 2022 reflect actual values without ...
Note: The 2022 annual estimates featured capture the impact of COVID-19 in New Zealand up to March 2022 and are expressed in nominal terms. Key provisional estimates for the year ended March 2022: total tourism expenditure was $26.5 billion, an increase of 2.7 percent ($704 million) from the previous year.
Premium Statistic Total tourism expenditure New Zealand 2022-2023, by product type Premium Statistic Total number of people employed in the tourism sector New Zealand 2014-2023
Note: Tables 19-26 contain detailed tables for the year ended March 2022.. 2023 Key Provisional Estimates. Note: The 2023 annual estimates featured capture the impact of COVID-19 in New Zealand through to March 2023 and are expressed in nominal terms. Key provisional estimates for the year ended March 2023: total tourism expenditure was $37.7 billion, an increase of 39.6% ($10.7 billion) from ...
Commentary. Visitor arrivals to New Zealand are expected to grow 5.4% a year, reaching 4.5 million visitors in 2022 from 3.1 million in 2015. Total international spend is expected to reach $16 billion in 2022, up 65.5% from 2015. Most of this forecasted growth is expected to come from holidaymakers and those visiting friends and relatives.
By the end of 2022, every RTO in New Zealand is expected to have a published destination management plan for their region. The New Zealand Government Budget directly related to tourism for the 2022/23 financial year is NZD 296 million. This includes NZD 3 million for tourism data. Budget 2022 reflects the shift away from time-bound COVID-19 ...
From April 2020 to February 2022, New Zealand's international tourist numbers plummeted, witnessing a short-lived recovery between April and July 2021, ... Statistics New Zealand, Monthly number ...
Download Tourism New Zealand's Annual Report, Statement of Intent and other corporate publications. Insights ... Tourism New Zealand Statement of Performance Expectations 2021/2022. Tourism New Zealand's forecast of performance for the period from 1 July 2021 to 30 June 2022. Download ...
Regional spend. This data is a good indicator of spend growth in a region over time, but it doesn't capture all tourism spending. Filter the reports by region or product-type using the drop-down menus. (Source: Ministry of Business, Innovation, and Employment)
Key tourism stats for year to March 2022. Total tourism: total tourism expenditure was $26.5 billion, an increase of 2.7 percent ($704 million) from the previous year ... Tourism was New Zealand's biggest export industry, contributing 20.1% of total exports. ... Statistics NZ Tourism Satellite Account year ended March 2019 (issued December 2020).
Tourist Arrivals in New Zealand averaged 68224.28 from 1921 until 2024, reaching an all time high of 529255.00 in December of 2018 and a record low of 40.00 in April of 1942. This page provides the latest reported value for - New Zealand Tourist Arrivals - plus previous releases, historical high and low, short-term forecast and long-term ...
2015-2021. 2014-2020. 2013-2019. 2012-2018. 2011 and earlier. Last updated: 30 June 2021. The Ministry of Business, Innovation and Employment's tourism forecasts are based on econometric modelling, current trends and forecasts of international factors, and are developed with tourism industry input.
Tourism New Zealand Chief Executive 2022/2023 at a glance of international visitor spend to $8.2B, and supporting conference bids worth $120M. Our activity was led by our global brand campaign "If You Seek" which was designed to build a strong desire and preference to visit
The 2022 annual estimates featured capture the impact of COVID -19 in New Zealand up to March 2022 and are expressed in nominal terms. Key provisional estimates for the year ended March 2022: • total tourism expenditure was $ 26.5 billion, an increase of 2.7 percent ($704 million) from the previous year
New Zealand tourism statistics for 2019 was 0.00, a 100% decline from 2018. International tourism receipts are expenditures by international inbound visitors, including payments to national carriers for international transport. These receipts include any other prepayment made for goods or services received in the destination country.
International tourists spent over $1.9 billion during trips to New Zealand in 2021/2022 (year ending march 2022). Spending was up 30.6% when compared with the over $1.3 billion spent the previous year (year ending march 2021) Spending is down 89% when compared with the over 17.6 billion spent for the year ending March 2020.
International Visitor Survey (IVS) Tourism and the economy. International travel. Tourism employment earnings and filled jobs. Cruise data. Monthly Regional Tourism Estimates (MRTEs, 2016-2020) Business Events Research Programme (2009-2019) Domestic Travel Survey 1999-2012.
The Intentions to Travel Market Deep Dive 2023 report are based on qualitative in-depth interviews. The output of this research distils the claimed experiences of consumers from 10 markets. The role of sustainability in destination and operator choice. The role of sustainability in destination and operator choice research was undertaken by ...
Before the pandemic, tourism was the largest export industry in New Zealand, contributing 20.1% of total exports. In 2022, international tourists spent around NZ$1.9 billion, or a slight increase from 2021. According to IBIS World, there are 579 hotels and resorts in New Zealand, with the market being worth $2 billion.
Total tourism expenditure in New Zealand from 2022 to 2023, by product type (in billion New Zealand dollars) [Graph], Statistics New Zealand, February 9, 2024. [Online].