Efficient Cyclist


From Past to Present: Average Tour de France Speeds
The Tour de France, the world’s most prestigious and grueling cycling race, has captivated audiences for over a century. Spanning three weeks and covering thousands of kilometers, the Tour de France is a true test of endurance, strategy, and sheer athletic ability. One of the most intriguing aspects of this iconic race is the average speed achieved by the peloton over the years.
The overall trend of winner’s average speed has steadily increased during the Tour’s history. In this article, I explore the factors that have contributed to its continual increase.

Table of Contents
The Early Years: Humble Beginnings
The Tour de France was first held in 1903, and the average speeds achieved in those early editions were significantly lower compared to modern standards. Factors such as the heavy steel bicycles, rough road conditions, and limited technological advancements contributed to relatively slow average speeds. For many of those early years, average speeds hovered around 25 kilometers per hour, with individual stages often taking several hours to complete.
The winner of the very first 1903 Tour de France achieved only 25.7 km/h average speed, while the slowest race was just 24.1 km/h in 1919.
In the early years of the Tour, the sport was very much one of breakaways. Race reports suggest that there were hardly any pelotons back then, which would have increased the speed considerably. Being in the front allowed leading riders the clearest view ahead, and would ensure that, after being delayed by a mechanical or a puncture (very common back then), they would have other strong riders around them. And there was presumably quite a lot of time spent fixing the mechanical issues, which was included in the total time.
Until 1910, there were no high mountains in the Tour, so you can imagine the average speeds would have been even lower if they had to climb, too.
Advancements in Technology
Advancements in technology have had a profound impact on cycling, revolutionizing the sport and pushing the boundaries of what is possible in terms of speed.
Lightweight equipment
The development of lightweight bicycles has been a game-changer. With the introduction of materials like carbon fiber, bike frames have become significantly lighter, while maintaining strength and rigidity. This reduction in weight allows riders to accelerate more effortlessly and tackle climbs with greater ease.
Aerodynamics
Aerodynamics have also become a crucial focus in bike design. By utilizing wind tunnel testing and computational fluid dynamics, engineers can optimize the shape of bike frames, wheels, and other components to minimize drag. This results in more streamlined and efficient designs, reducing the resistance cyclists face when riding at high speeds. The integration of components, such as internal cable routing and hidden brakes, further improves the aerodynamic performance of modern bicycles.
It’s not only about bikes, either. Cycling clothing, helmets, shoes etc. also have a huge influence on aerodynamics .
Gear systems have seen significant advancements as well. The derailleur was only introduced in the Tour de France in 1937 – it was all single-speed before then. The Tour’s founder Henri Desgrange has famously said “I still feel that variable gears are only for people over 45. Isn’t it better to triumph by the strength of your muscles than by the artifice of a derailer?”
The introduction of index shifting has revolutionized gear changes, providing precise and instantaneous shifts at the touch of a button. This allows riders to maintain their momentum and power output, resulting in smoother transitions between gears.
Then came electronic shifting. Its impact is far less than that of indexed shifting but it still adds further improvements: It eliminates the need for manual adjustments and reduces the risk of misshifting, providing riders with more confidence and focus on their performance.
Wheels, an essential component of a bike, have undergone substantial improvements. Up until 1934 bicycle rims were all wooden – previously metal rims had been banned. Wooden rims tend to have more flex, which saps power.
Aluminum rims were standard for more than half a century; carbon fiber wheels only became mainstream in the pro cycling in the late 90s to early 00s. Carbon fiber wheels are lighter, resulting in improved climbing speeds. Their lightweight construction also allows for the creation of deep aerodynamic profiles, which can accommodate more material without adding substantial weight. Such wheels are standard on flat stages, as they reduce drag.
Then there are improvements in tires, offering reduced rolling resistance, which can make a significant impact, especially on the climbs, when aerodynamic drag matters less.
Moreover, the progress made in hub designs and bearing technologies has significantly reduced friction, resulting in improved overall efficiency of wheelsets.
Data-driven performance
Data-driven performance in pro cycling has revolutionized the way teams and riders approach training, racing, and performance analysis.
In the old days, cycling heavily depended on subjectivity and intuition, with limited access to measurable metrics. But with the advent of advanced technologies and the proliferation of cycling data sensors, the sport has undergone a significant transformation. Nowadays, riders and teams have an abundance of data at their disposal, encompassing metrics such as power output, heart rate, cadence, speed, and even muscle monitoring. This wealth of data is gathered during training rides, races, and even within controlled laboratory settings.
This helps coaches, and riders gain deep insights into performance, identify strengths and weaknesses, optimize training programs, and make strategic decisions during races. The result is more precise and individualized training plans, race strategies, and equipment choices, leading to improved performance and thus, higher speeds.
The understanding of sports science, training methodologies, and nutrition has also played a vital role. Athletes now benefit from access to state-of-the-art training programs, scientific testing, and advanced nutritional strategies aimed at optimizing their performance. The focus on recovery, specialized training camps, and individualized coaching has propelled riders to attain heightened levels of physical and mental readiness, ultimately resulting in faster average speeds.
Race Tactics and Strategies
Race tactics and strategies have also evolved over time, leading to faster racing. The introduction of team-based racing, with riders working together to protect their leaders and create tactical advantages, has significantly influenced the pace of the peloton.
This evolution took the better part of the century: from basically solo breakaway riding in the early 1900s to ‘one-man teams’, such as in Bartali/Coppi and later Mercx, times, to full-fledged team tactics from the late 20th century onwards. This meant more coordinated team efforts, for example utilizing domestiques to support their leaders in the mountains, providing pacing, protection, and strategic assistance. That allows leaders to save effort for when it really matters, and ride at higher speeds.
Route distance
The race distance has trended down throughout the 20th century, and I wonder if that may have contributed to the increases in average speeds. See the graph below. (The three outliers are the very first three years of the Tour.)

Similar Posts

The Evolution of Bicycle Brakes
Generally brakes are not the first thing that comes to mind when talking about bikes. Typically we like to boast about stuff that gives us speed, looks good or is comfortable: the frame, the wheels, the handlebar. Aerodynamics. Rolling resistance. Drivetrain friction. But stopping isn’t as sexy, though it saves our lives. Let’s see what…

Can Listening to Music Enhance your Cycling Performance?
Can the rhythm of music harmonize with the cadence of my pedal and somehow elevate my cycling performance? Here I’ll explore the science behind the connection between music and cycling performance. I’ll delve into the contrasting effects of music on aerobic and anaerobic performance, explore how music influences distance perception, and examine the impact of…

A Visit to Museo del Ciclismo – Madonna del Ghisallo
I recently had the privilege of immersing myself in the world of cycling at Museo del Ciclismo. Nestled on the Madonna del Ghisallo hill in Magreglio, Italy, this fantastic museum is a treasure trove of history, innovation, and the endless passion for cycling. From vintage utility bicycles that remind of a bygone era to winning…

What is the True Cost of Owning a Bike?
We often deceive ourselves about the true expenses associated with our bikes. We convince ourselves that if a new bike costs, say $3000, then that’s the total expenditure. However, the reality is more complex: the cumulative expenses of wearable parts can add up significantly over time. So, what is the actual cost of owning a…

Myths about Titanium Frames Comfort and Ride Quality
When it comes to choosing a bike frame, riders often find themselves inundated with information and marketing claims about various materials. One material that has gained considerable attention and a devoted following is titanium. While titanium has some good characteristics, such as corrosion resistance, fatigue life, and aesthetics, titanium bike frames have been touted as…

Riding Uphill: Efficiency of Seated and Standing Cycling
When it comes to climbing, there are two primary body positions: seated and standing. Often, the decision of whether to get out of the saddle is made instinctively, trying to provide some rest to fatigued muscle groups or to add some explosive power. But which is more efficient? Let’s explore different aspects of seated vs…
Leave a Reply Cancel reply
Your email address will not be published. Required fields are marked *
Save my name, email, and website in this browser for the next time I comment.
BikingulTimate.com
Tour de France Speed – How Fast Do Cyclists Ride in MPH During the Famous Bike Race

How Fast Do Cyclists Ride at the Tour de France?
The Tour de France is one of the most iconic and grueling cycling events in the world. Every year, the world’s top cyclists race across France over a period of three weeks, covering around 2,000 miles in total. Naturally, riders need to maintain incredibly high speeds just to complete each stage on time, let alone compete for victory. So in this article, I’ll break down average and maximum speeds at the Tour de France, as well as factors that influence a rider’s pace.
Average Speeds
- Flat stages: Riders average around 25-27 mph (40-43 km/h) on relatively flat stages with few climbs.
- Hilly stages: Speeds drop to around 22-24 mph (35-38 km/h) when the route includes multiple short, steep climbs.
- Mountain stages: In the Pyrenees or Alps, average speeds may fall as low as 18-20 mph (29-32 km/h) over major mountain passes.
These averages can fluctuate based on weather conditions, the composition of breakaway groups, and each rider’s form and equipment on any given day. Nevertheless, sustaining speeds in the high 20s mph is no easy feat over several hours of cycling after two intense weeks of racing. As one rider told me, “To keep up that pace day after day takes insane levels of fitness, focus and pain tolerance.”
Maximum Sprints
While averages indicate general speed over a full stage, short bursts of maximum effort are also crucial – such as when climbing steep inclines or sprinting for the finish line. Some true sprinters are capable of hitting speeds up to 75 mph during the final few hundred meters, though they can only maintain that intensity for seconds before fatiguing.
From my experience racing, full-gas sprints at even 40-45 mph require an explosive strength that few weekend amateur cyclists can match. There’s a reason the top professionals train obsessively to develop their anaerobic capacity. As one Tour winner said, “You have to push your mind and body to a place most people didn’t even know existed.”

Factors Affecting Pace
Several factors cause speeds to fluctuate above and below the averages mentioned:
- Terrain – Downhills allow rest, uphills slow riders.
- Weather – Headwinds cut speeds; tailwinds provide boosts.
- Tactics – Large breakaways set fast paces; slow tactics precede final climbs.
- Mechanicals – Flats, crashes or bike malfunctions force unplanned stops.
- Fatigue – Later stages see declining average speeds as riders tire.
- Equipment – Aero helmets and bikes shave seconds; deep wheels climb faster.
In general, stages with more sustained climbs tend to see lower speeds. But individual strengths and race positioning play huge parts too. As one rider told me, “I’ve flown on flat stages when breaking away, but crawled up hills buried deep in the grupetto.” Clean equipment, tactics, fitness and a bit of luck all influence whether a rider posts an “A” or “C” performance on any given day.
The Impact of Drafting
Drafting – riding closely behind others to utilize their slipstream – is also critical to sustaining high speeds over three-week tours. Research has shown cyclists in the primary drafting position directly behind the leader enjoy a roughly 30% reduction in wind resistance compared to riding alone.
In the peleton, riders constantly switch off at the front to draw on this advantage. As one expert explained, “The dynamics of teamwork at the Tour are almost magical. Riders may swap hundreds of times in a single stage to share the load.” Following wheels through corners also allows conserves energy versus braking independently.

Casual cyclists groaning under single-digit headwinds can only imagine the energy savings pro riders reap from perfect pacing and tightly-packed peleton formation. It’s no exaggeration to say drafting extends what seems humanly possible over multi-day stage racing.
The Human Capability
So in summary – while average speeds range from 18-27 mph depending on the stage, world-class cyclists are capable of generating power outputs equivalent to sprinting over 45 mph for short bursts. Sustaining those kinds of wattages day after day for three weeks of racing truly pushes the limits of human endurance.
As one ex-pro told me, “Most people don’t grasp how crazily fit you need to be to simply endure the Tour, before even considering fighting for the win.” Perfecting the interplay of anaerobic power, stamina, equipment and tactics allows riders to maximize their potential and push speed barriers ever higher each year. The Tour continues to amaze through displays of incredible speed despite grueling conditions – a testament to both the infrastructure of pro cycling and raw human athletic talent.
Does this help explain the typical speeds achieved over different parts of the Tour de France route? Let me know if you need any clarification or have additional questions!
Average Speeds of Tour de France Winners
How fast do cyclists ride during the tour de france.
Cyclists in the Tour de France can basically reach speeds of around 15-30 mph on flat stages. However, going downhill they can potentially go even faster, reaching speeds over 40 mph. It’s pretty stunning how quick they can ride a bike!
Do they ride that fast the whole way?
No way, riding at those top speeds is sort of draining. The pros have to pace themselves to save energy for later in the race. On hilly or mountain stages, their average speed drops below 15 mph as they grind it out in lower gears. But they still push hard on the flats!
How does wind speed affect their riding?
A headwind can really slow the cyclists down, sometimes by as much as 5 mph. Strong tailwinds have the opposite effect and allow them to cruise even faster, which is amazing on those flat stages. One expert said crosswinds make handling the bike a bit scarier too. I’d be blown all over the road!
Are there speed limits on the course?
Surprisingly, there are no set speed limits for the cyclists on the Tour route. The officials kind of just let them rip as fast as they can go. But is that fair – what if someone got clocked at 60 mph zooming downhill? The organizers appear to take safety very seriously though, with lots of barricades and signs to protect spectators.
What if they have to take a nature break?
Good question! Sometimes nature calls in the middle of a long hard stage. The poor guys have to kind of scamper off the road as quick as possible if the urge strikes. Funnily enough, a few have been known to go rocking behind a bush at 20+ mph without missing a pedal stroke – they must have bladders of steel!
How do they power up climbs if they can’t keep those speeds?
When tackling steep climbs in the Alps or Pyrenees, the riders have to grin and bear it in their lowest gears. They grind away at maybe only 5-10 mph, utterly spent. Stronger climbers can push 15 mph on minor upslopes. Lance Armstrong once quoted maintaining 12 mph up the crazy Mount Ventoux – I’d be walking!
Related Posts
Calculate your bicycle average speed and improve your rides.
What is the Average Speed of a Bicycle? As a lifelong cycling enthusiast, I’m often asked what the average speed…
Reduce Rolling Resistance and Pedal Harder Uphill When Mountain Biking | Tips for Mountain Bike Tire Pressure and Wheel Maintenance
Understanding Mountain Bike Rolling Resistance and How to Reduce It A common question mountain bikers have is how to decrease…
Average Speeds at the Tour de France – How Fast Do Cyclists Really Ride During this Grueling Race?
Understanding the Amazing Speeds of the Tour de France Have you ever wondered just how insanely fast the cyclists in…
Greenville Criterium
Tour of turkey, tour de romandie, uci mtb eliminator world cup - barcelona, spartanburg regional healthcare crit, uci bmx racing world cup tulsa, athens orthopedic clinic twilight crit, la vuelta españa femenina, curiosity lab criterium, spin the district: union city, eschborn-frankfurt, uci mtb fort william, spin the district: hapeville, gp morbihan (coupe de france), giro d'italia, how does your average bike speed compare with tour de france pros, how does your average bike speed stack up with the fastest riders in the world.

The Tour de France is the pinnacle when it comes to cycling competitions. It is one of the most-watched sporting events in the world and showcases some of the fittest athletes on the planet. The pure athleticism that is on display during this 21-day, 2,200-mile race is inspiring, enlivening, and these cyclists seem somewhat superhuman.
You might be asking yourself, “So how fast are they even going?” Or, “How do I compare to these athletes?” Luckily for you, with today’s technology, various metrics can be tracked during these cycling competitions, so everyone can compare their statistics to those of the pros. As with any metric, the speeds at which the Tour de France pros cycle will vary, but there are averages that have been tracked for decades now.
Here are a few of the average speeds for the professional cyclists that race in the Tour de France:
Average Speed on Flat Ground: 25-28 mph
The average speed for professional cyclists while traversing on flat terrain is 25-28 mph. The average amateur cyclist travels about 17-18 mph while on flat ground. For many pro athletes racing in the Tour de France, being able to maintain a fast speed on flat terrain allows them to simply stay competitive with the other athletes. It is in the climbing portions of the Tour de France that the best gain separation from the peloton.
Average Cobblestone Speed: 22-24 mph
In every Tour de France, there is at least one section of cobblestone that the cyclists must ride through -- sometimes, though, this is replaced with a stretch of gravel pavement. The small grooves in the road and uneven terrain can be difficult to tread, but these athletes still average an impressive 22-24 mph.
Average Speed Climbing: 12.8 mph
In the 2019 Tour de France, the athletes averaged 12.8 mph while trudging through the infamous climbs of the race. These athletes are literally cycling up and through the Pyrenees and Alps during this phase of the Tour de France, making for some of the most memorable moments of the Tour.
Fastest Recorded Speed: 63.1 mph
The fastest recorded speed of the Tour de France came from German Nils Politt while descending Col de Vars during stage 18 of the race. This was the second of four climbs in the stage, and Politt was the first-ever rider to break the 100 km/hr barrier by traveling at a speed of 101.5 km.hr on this descent.
Jonas Vingegaard Tour de France 2022 | Average Speed: 26.11
Jonas Vingegaard won his first Tour de France in 2022 on his second time participating in the tour. He spent the majority of the race trading leads back and forth with fan-favorite, Tadej Podacar. Vangegaard pushed through stage 19 and crossed the finish line 2 minutes and 43-second ahead of Podačar. After a total of 79 hours, 33 minutes, and 20 seconds on the bike, Jonas Vangegaard became the first Danish Tour de France champion since 1996
Tadej Pogačar Tour de France 2021 | Average Speed: 25.5 mph
Tadej Podačar was only 22 years old when he earned his second consecutive win at the Tour de France. Podačar made the victory look easy when he also earned a polka-dot jersey for top climber and white jersey for best young cyclist. His quick rise to first place had people consider him one of the most exceptional young cyclists the Tour de France had seen in years. He finished the race in 82 hours, 56 minutes and 36 seconds.
Tadej Pogačar Tour de France 2020 | Average Speed: 24.77
Tadej Podačar for UAE Team Emirates shocked fans at his 2020 Tour de France debut. At 21 years old he managed to break all expectations and snatch a victory from Primoz Roglic, who was expected to cruise to a first-place finish. In the final stage of the tour, Podačar sped through a 57-second deficit and earned his first yellow jersey, becoming the youngest Tour de France Winner in 111 years.
Egan Bernal Tour de France 2019 | Average Speed: 25.2 mph
The 2019 Tour de France winner, Egan Bernal of Colombia, averaged 25.2 mph. He is the first Latin American to ever win the Tour de France. At age 22, he is also the youngest Tour de France winner in modern racing history. He finished the 2,091.4 mile race in exactly 82 hours and 57 minutes.
While not every cyclist has aspirations of ever racing in the Tour de France, having these metrics is a fun way for everyday cyclists to compare themselves to the superhuman riders that conquer the most famous cycling race in the world.
- Feature Story
Related Content

Apr 25, 2024

The average speed reached by the winners of the Tour de France increased by 53.9% since the first race in 1903 through 2016. This means an average speed increase rate of 0.42% each Tour.
The upward trend reached its peak at 41.65 km/h with the 7th consecutive win by the US cyclist Lance Armstrong in 2005. Average speeds fell since then until 2010, in spite of the participation of the same fast riders, which suggests more stringent anti-doping regulations and controls (see areppim's insight ). Since 2010, the average speed of the Tour winner resumed its ascending trend, approaching the long-term linear trend (red line in the chart), before slowing down a bit in 2015 and especially in 2016.
One cannot avoid suspecting the doings of illegal sports medical practices to be responsible for such high level performances. Indeed, the 2015 Tour had one rider excluded for positive control on drugs, and hot controversy surrounded the Tour winner's allegedly extraordinary performance. The doping affairs that tarnished the Tour champions' reputations since 1996 cast a dubious halo on the popular sports event. But, for that matter, other sports are not immune: tennis, soccer, running, practically all sport disciplines have been subject to on-going controversy after whistle blowers alerted to a variety of doping practices.
Sources: Le Tour de France
Tour de France average speed: How fast are riders at the Tour?
How fast do professional riders do the lap around France?
- Sign up to our newsletter Newsletter

The general trend at the Tour de France , since its start in 1903, is that the speed of the riders is going up.
This has happened due to multiple reasons. Mainly it is due to the quality of kit getting better and better every year as science and technology become more and more involved in the sport.
>>> Tour de France facts: stats from the world’s biggest bike race
Bikes and kit becoming as aerodynamic as it is possible to be along with new materials that are faster through the air than human skin itself have changed bike racing hugely in recent years.
On the other side of this, some of the average speeds in past Tours have potentially been due to leading riders having a little extra help than just aero kit and fast rolling tyres.
You won't be surprised to know that the fastest Tour de France on record belongs to a certain Lance Armstrong .
The American former rider had all seven of his Tour titles taken away from him after it was exposed that had doped during all his victories.
Get The Leadout Newsletter
The latest race content, interviews, features, reviews and expert buying guides, direct to your inbox!
He completed the 2005 race with an amazing average speed of 41.7km/h, which is over one km/h faster than the modern day riders who ride with much faster kit.
>>> Tour de France bikes: Who’s riding what in 2020?
On the flip side, the slowest ever Tour was in 1919, after World War One. The race was won by Belgian Firmin Lambot with an average speed of 24.1km/h.
In the last 10 years the pace hasn't differed too much, staying around the 39 - 40km/h mark, but it does look to be steadily increasing as the technology and training means that riders can go faster than ever before.
The fastest ride in the last 10 years goes to Chris Froome 's last overall victory in 2017.
The race only had three summit finishes and multiple flatter stages and a lot of long descents along with two time trials, which explains the higher than normal speed.
The last two editions of the race have both been around 200km shorter than the 2017 race.
Tour de France average speed (last 11 editions)
2009, Alberto Contador : 40.03km/h
2010, Andy Schleck : 39.59km/h
2011, Cadel Evans : 39.79km/h
2012, Bradley Wiggins : 39.93km/h
2013, Chris Froome: 40.68km/h
2014, Vincenzo Nibali : 40.68km/h
2015, Chris Froome: 39.64km/h
2016, Chris Froome: 39.63km/h
2017, Chris Froome: 41.00km/h
2018, Geraint Thomas : 40.23km/h
2019, Egan Bernal: 40.58km/h
Thank you for reading 20 articles this month* Join now for unlimited access
Enjoy your first month for just £1 / $1 / €1
*Read 5 free articles per month without a subscription
Join now for unlimited access
Try first month for just £1 / $1 / €1
Hi, I'm one of Cycling Weekly's content writers for the web team responsible for writing stories on racing, tech, updating evergreen pages as well as the weekly email newsletter. Proud Yorkshireman from the UK's answer to Flanders, Calderdale, go check out the cobbled climbs!
I started watching cycling back in 2010, before all the hype around London 2012 and Bradley Wiggins at the Tour de France. In fact, it was Alberto Contador and Andy Schleck's battle in the fog up the Tourmalet on stage 17 of the Tour de France.
It took me a few more years to get into the journalism side of things, but I had a good idea I wanted to get into cycling journalism by the end of year nine at school and started doing voluntary work soon after. This got me a chance to go to the London Six Days, Tour de Yorkshire and the Tour of Britain to name a few before eventually joining Eurosport's online team while I was at uni, where I studied journalism. Eurosport gave me the opportunity to work at the world championships in Harrogate back in the awful weather.
After various bar jobs, I managed to get my way into Cycling Weekly in late February of 2020 where I mostly write about racing and everything around that as it's what I specialise in but don't be surprised to see my name on other news stories.
When not writing stories for the site, I don't really switch off my cycling side as I watch every race that is televised as well as being a rider myself and a regular user of the game Pro Cycling Manager. Maybe too regular.
My bike is a well used Specialized Tarmac SL4 when out on my local roads back in West Yorkshire as well as in northern Hampshire with the hills and mountains being my preferred terrain.

Giant filed a suit against Stages in February and four team members left the latter to join Giant
By Michelle Arthurs-Brennan Published 25 April 24

Cameron Wurf is both a member of Team Ineos Grenadiers and an accomplished professional long course triathlete who has racked up numerous World Tour and Ironman race finishes across his career.
By Kristin Jenny Published 24 April 24
Useful links
- Tour de France
- Giro d'Italia
- Vuelta a España
Buyer's Guides
- Best road bikes
- Best gravel bikes
- Best smart turbo trainers
- Best cycling computers
- Editor's Choice
- Bike Reviews
- Component Reviews
- Clothing Reviews
- Contact Future's experts
- Terms and conditions
- Privacy policy
- Cookies policy
- Advertise with us
Cycling Weekly is part of Future plc, an international media group and leading digital publisher. Visit our corporate site . © Future Publishing Limited Quay House, The Ambury, Bath BA1 1UA. All rights reserved. England and Wales company registration number 2008885.
- Race Previews
- Race Reports
- Race Photos
- Tips & Reviews
From Cobbles to Cubicles: Charting the Champions in the Roubaix Showers
Lily williams commits to human powered health until 2026, paris roubaix femmes 2024 race preview, elisa longo borghini sets sights on ardennes, skips paris-roubaix femmes, michaela drummond triumphs in inaugural région pays de la loire tour for women.

Email: [email protected]
The Evolution of Speed in the Tour de France

Mathew Mitchell
- Published on June 23, 2023
- in Men's Cycling

One of the most intriguing aspects of the Tour de France, beyond the dazzling victories and dramatic rivalries, is the evolution of the race’s average speed. Throughout its history, a multitude of factors have contributed to significant changes in the pace of the peloton, from technological advancements to race strategies. Let’s embark on a journey through the annals of the Tour to examine this transformation.
Table of Contents
The early editions
The early years of the Tour de France were characterised by lengthy stages often exceeding 400 km, rudimentary bicycles, and rugged roads, which resulted in a slow pace compared to today’s standards. Maurice Garin, the winner of the first Tour in 1903, achieved an average speed of 25.7 km/h, or approximately 16 mph. This may seem leisurely in the modern era, but given the conditions at the time, it was an impressive feat.
From these humble beginnings, the Tour’s average speed gradually increased as a result of several key factors. First and foremost, technological advancements played a significant role. Innovations such as derailleur gears, lighter frames made from aluminium or carbon fibre, aerodynamic clothing, and improvements in nutrition and training regimes all contributed to an upward trend in the peloton’s pace.
Fastest editions of the Tour de France
Among the fastest five editions of the Tour de France, the 2005 edition holds the record, with an astonishing average speed of 41.7 km/h, or approximately 25.9 mph, achieved by Lance Armstrong. However, it’s worth noting that Armstrong was later stripped of his titles due to doping . 2003, 2015, 2017, and 2019 Tours are also among the fastest, with average speeds ranging from 40.7 km/h (25.3 mph) to 40.9 km/h (25.4 mph). 2022’s Tour de France , won by Jonas Vingegaard, saw a new record set with an average speed of 42.03 km/h (26.1mph). That’s now a jump in the Tour de France average mph of 10mph since the inaugural edition in 1903.
Slowest editions of the Tour de France
Contrastingly, the slowest Tours de France typically date back to the early 20th century, primarily due to the aforementioned factors of longer stages, simpler bicycles, and challenging road conditions. The five slowest Tours were the editions from 1919, 1922, 1923, 1924, and 1926, with average speeds ranging from 24.1 km/h (15 mph) to 24.3 km/h (15.1 mph).

How and why the average speed has changed over time
It’s crucial to mention that strategies have also evolved significantly, with modern cycling teams employing more sophisticated tactics, optimising rider roles, and using advanced data analysis to gain an edge. The increased professionalism in the sport has contributed to the upward trend in speed.
Looking forward, it’s exciting to contemplate what could further increase the Tour de France’s average speed. Advancements in bicycle technology continue at a rapid pace, with continuous improvements in weight, aerodynamics, and power transfer. Similarly, cutting-edge training techniques, informed by genetics and sophisticated performance data, will continue to enable cyclists to push the boundaries of human endurance and speed.
Furthermore, improvements in road surfaces, planning of race routes, and even changes in race rules could have an impact. For example, more downhill finishes could raise the overall average speed, although the safety of riders would always be paramount.
In conclusion, the evolution of speed in the Tour de France is a fascinating aspect of this iconic race. From the early Tours, characterised by their gruelling pace and hardy riders, to the high-speed, technology-driven spectacle of today, the race continues to captivate and surprise. As we look to the future, we can expect the boundaries of speed, just like the race itself, to be continuously challenged and redefined.
Related Posts

- Tour de France
- Giro d'Italia
- La Vuelta ciclista a España
- World Championships
- Milano-Sanremo
- Amstel Gold Race
- Tirreno-Adriatico
- Liège-Bastogne-Liège
- Il Lombardia
- La Flèche Wallonne
- Paris - Nice
- Paris-Roubaix
- Volta Ciclista a Catalunya
- Critérium du Dauphiné
- Tour des Flandres
- Gent-Wevelgem in Flanders Fields
- Clásica Ciclista San Sebastián
- UAE Team Emirates
- Arkéa - B&B Hotels
- Astana Qazaqstan Team
- Alpecin-Deceuninck
- Bahrain - Victorious
- BORA - hansgrohe
- Decathlon AG2R La Mondiale Team
- EF Education-EasyPost
- Groupama - FDJ
- INEOS Grenadiers
- Intermarché - Wanty
- Lidl - Trek
- Movistar Team
- Soudal - Quick Step
- Team dsm-firmenich PostNL
- Team Jayco AlUla
- Team Visma | Lease a Bike
- Grand tours
- Top competitors
- Final GC favorites
- Stage profiles
- Riders form
- Countdown to 3 billion pageviews
- Favorite500
- Profile Score
- Stage 21 Results
- Startlist quality
- All stage profiles
- Hardest stages
- Winners and leaders
- Prizemoney ranking
- Fastest stages
- Statistics - Statistics
- Startlist - Startlist
- More - More
- Teams - Teams
- Nations - Nations
- Route - Route
- Results - Results
- »
- Average speed per stage
Follow-up links
- Fastest editions
- Most constant rider
- Smallest sum of results
- Most bonifications
- Hottest stages
- Leader jerseys
- Best worse result
- Combative riders
- Fastest first and last hour
- Timegap chart
- GC without TTs
- GC Without 1 stage
- GC without time bonusses
- Most GC time changes
- Points GC breakdown
- Least predictable
Grand Tours
- Vuelta a España
Major Tours
- Volta a Catalunya
- Tour de Romandie
- Tour de Suisse
- Itzulia Basque Country
- Milano-SanRemo
- Ronde van Vlaanderen
Championships
- European championships
Top classics
- Omloop Het Nieuwsblad
- Strade Bianche
- Gent-Wevelgem
- Dwars door vlaanderen
- Eschborn-Frankfurt
- San Sebastian
- Bretagne Classic
- GP Montréal
Popular riders
- Tadej Pogačar
- Wout van Aert
- Remco Evenepoel
- Jonas Vingegaard
- Mathieu van der Poel
- Mads Pedersen
- Primoz Roglic
- Demi Vollering
- Lotte Kopecky
- Katarzyna Niewiadoma
- PCS ranking
- UCI World Ranking
- Points per age
- Latest injuries
- Youngest riders
- Grand tour statistics
- Monument classics
- Latest transfers
- Favorite 500
- Points scales
- Profile scores
- Reset password
- Cookie consent
About ProCyclingStats
- Cookie policy
- Contributions
- Pageload 0.1782s
What Is the Tour de France Average Speed?
We examine the average speed and other metrics of the world’s best cyclists. How would you stack up?

Gear-obsessed editors choose every product we review. We may earn commission if you buy from a link. How we test gear.
We all know that the pro cyclists that race in the men’s Tour de France are the best in the world. We also know that they’re fast— really fast. Have you ever wondered about the Tour de France average speed, though, and how you’d fare against a pro? Well, now you can see for yourself.
Average Time Trial Speed

A Tour pro’s ability to produce more power for longer means that he would complete a 30K time trial about 20 minutes faster than the average rider. In other words, he’s really hammering.
Average Rider: 19 to 20 mph
Tour Pro: 29 to 31 mph
Average Speed on Flat Terrain

Even on flat land, a pro’s average speed in the Tour de France needs to be way up there in order to stay in the race. In fact, it’s usually about double that of an average rider.
Average Rider: 17 to 18 mph
Tour Pro: 25 to 28 mph
Maximum Sprint Power

Sprinters generate incredible amounts of power in the final 15-second dash for the line. A rider like Mark Cavendish might hit 1,500 watts at the end of a flat field sprint.
Average Rider: 600 to 800 watts
Tour Pro: 1,200 to 1,400 watts
Average Speed Over Cobblestones

The Tour de France often features at least one section of cobblestones , known locally as pavé (though sometimes that’s exchanged for a stretch of gravel) . On a tough section, pros can average an incredible 22 to 24 mph.
Average Rider: 14 to 16 mph
Tour Pro: 22 to 24 mph
Average Resting Heart Rate

Team EF Education-EasyPost utilized WHOOP straps during the 2020 Tour to collect detailed biometric data on the athletes 24/7 over the course of the entire 21-stage race, with remarkable results. The data showed an average resting heart rate of 42 beats per minute for the team before the start of the Tour, and 40 bpm after the first rest day. And in other jaw-dropping heart rate stats, team cyclist Neilson Powless spent 38 percent of Stage 8 that year in the 90- to 100-percent zone for his max heart rate .
Average Rider : 60 to 100 bmp
Tour Pro : ~40 bmp
Sandwiches Consumed

Soigneurs (all-purpose team assistants) make lunches for everyone on the team, including the staff. With about 12 to 15 staffers supporting a given team’s nine riders in France, that’s a lot of bread and a lot of sandwiches consumed over the course of three weeks.
Average Rider: 1 to 3 sandwiches
Tour Pro: ~30 sandwiches
Daily Bottles of Drink Mix Guzzled

Depending on conditions, you might mix one or two bottles during one of your ride. A Tour de France soigneur might mix between 40 and 120 bottles for the team on each stage, which means an individual rider may throw back up to a dozen bottles or more.
Average Rider: 1 to 2
Tour Pro: 4 to 13
How Long it Takes to Climb the Col du Tourmalet

A pro climber will probably average about 350 to 375 watts on the climb up the Col du Tourmalet , one of the most famous climbs not just in the Tour, but in the entire cycling world. An ordinary rider would generate closer to 175 to 200—which means the Tour’s top climbers could ascend the Col nearly twice during your trip to the top.
Average Rider: 115 minutes
Tour Pro: 60 minutes
Bikes at Your Disposal

Depending on the rider and the team’s bike sponsor, most pros come to the Tour with an aero road bike for flatter stages, a climbing bike for the mountains, and a time-trial bike—not to mention spares. A general classification contender like Tadej Pogačar might have two or three of each.
Average Rider: 1 to 2 bikes
Tour Pro: 4 to 5 bikes

Since getting hooked on pro cycling while watching Lance Armstrong win the 1993 U.S. Pro Championship in Philadelphia, longtime Bicycling contributor Whit Yost has raced on Belgian cobbles, helped build a European pro team, and piloted that team from Malaysia to Mont Ventoux as an assistant director sportif. These days, he lives with his wife and son in Pennsylvania, spending his days serving as an assistant middle school principal and his nights playing Dungeons & Dragons.
.css-1t6om3g:before{width:1.75rem;height:1.75rem;margin:0 0.625rem -0.125rem 0;content:'';display:inline-block;-webkit-background-size:1.25rem;background-size:1.25rem;background-color:#F8D811;color:#000;background-repeat:no-repeat;-webkit-background-position:center;background-position:center;}.loaded .css-1t6om3g:before{background-image:url(/_assets/design-tokens/bicycling/static/images/chevron-design-element.c42d609.svg);} Cycling Tips

How to Avoid Bonking on Rides

5 Spring Training Mistakes

Not Reaching Your Goals? Here are Twelve Fixes.

How to Plan a Century Ride Route

Hill Repeats to Help You Dominate Mountain Races

How to Tell if You’re Ready for a Century Ride

15 Ways to Cycle Faster

How to Improve Cadence, According to Pros

How to Corner on the Bike, According to a Pro

How to Release Your Diaphragm and Why You Should

How to Find the Right Bike Seat Height for You
2-FOR-1 GA TICKETS WITH OUTSIDE+
Don’t miss Thundercat, Fleet Foxes, and more at the Outside Festival.
GET TICKETS
BEST WEEK EVER
Try out unlimited access with 7 days of Outside+ for free.
Start Your Free Trial
Powered by Outside
Tour de France winners and their average speeds
2011 3431km (5489.6m),180 starters, 167 finishers (93%); winner: cadel evans, 34, avg: 39.8 kph (24.9 mph) 2010 3642km (5827.2m),180 starters, 170 finishers (94%); winner: alberto contador, 27, avg: 39.6 kph (24.7 mph) 2009 3459km (5534.4m),180 starters, 156 finishers (87%); winner: alberto contador, 26, avg: 40.3 kph (25.2 mph) 2008 3559km (5694.4m),180 starters, 145 finishers (81%); winner: carlos sastre, 33, avg: 40.5 kph (25.3 mph) 2007 3570km (5712m),189 starters, 141 finishers (75%); winner: alberto contador, 24, avg: 39.2 kph (24.5 mph).
Heading out the door? Read this article on the new Outside+ app available now on iOS devices for members! >","name":"in-content-cta","type":"link"}}'>Download the app .
- 2011 3431km, (2144m); 198 starters, 167 finishers (84%); Winner: Cadel EVANS, 34, avg: 39.8 kph (24.9 mph)
- 2010 3642km, (2276m); 197 starters, 170 finishers (86%); Winner: Alberto CONTADOR, 27, avg: 39.6 kph (24.7 mph)
- 2009 3459km, (2162m); 180 starters, 156 finishers (87%); Winner: Alberto CONTADOR, 26, avg: 40.3 kph (25.2 mph)
- 2008 3559km, (2224m); 180 starters, 145 finishers (81%); Winner: Carlos SASTRE, 33, avg: 40.5 kph (25.3 mph)
- 2007 3570km, (2231m); 189 starters, 141 finishers (75%); Winner: Alberto CONTADOR, 24, avg: 39.2 kph (24.5 mph)
- 2006 3657km, (2286m); 176 starters, 139 finishers (79%); Winner: Oscar PEREIRO, 30, avg: 40.8 kph (25.5 mph)
- 2005 3593km, (2246m); 189 starters, 155 finishers (82%); Winner: Lance ARMSTRONG, 34, avg: 41.7 kph (26 mph)
- 2004 3391km, (2119m); 188 starters, 147 finishers (78%); Winner: Lance ARMSTRONG, 33, avg: 40.6 kph (25.3 mph)
- 2003 3427km, (2142m); 198 starters, 147 finishers (74%); Winner: Lance ARMSTRONG, 32, avg: 40.9 kph (25.6 mph)
- 2002 3278km, (2049m); 189 starters, 153 finishers (81%); Winner: Lance ARMSTRONG, 31, avg: 39.9 kph (25 mph)
- 2001 3458km, (2161m); 189 starters, 144 finishers (76%); Winner: Lance ARMSTRONG, 30, avg: 40.1 kph (25 mph)
- 2000 3662km, (2289m); 177 starters, 128 finishers (72%); Winner: Lance ARMSTRONG, 29, avg: 39.6 kph (24.7 mph)
- 1999 3870km, (2419m); 180 starters, 141 finishers (78%); Winner: Lance ARMSTRONG, 28, avg: 40.3 kph (25.2 mph)
- 1998 3875km, (2422m); 189 starters, 96 finishers (51%); Winner: Marco PANTANI, 28, avg: 40 kph (25 mph)
- 1997 3950km, (2469m); 198 starters, 139 finishers (70%); Winner: Jan ULLRICH, 24, avg: 39.2 kph (24.5 mph)
- 1996 3765km, (2353m); 198 starters, 129 finishers (65%); Winner: Bjarne RIIS, 32, avg: 39.2 kph (24.5 mph)
- 1995 3635km, (2272m); 189 starters, 115 finishers (61%); Winner: Miguel INDURAIN, 31, avg: 39.2 kph (24.5 mph)
- 1994 3978km, (2486m); 189 starters, 117 finishers (62%); Winner: Miguel INDURAIN, 30, avg: 38.4 kph (24 mph)
- 1993 3714km, (2321m); 180 starters, 136 finishers (76%); Winner: Miguel INDURAIN, 29, avg: 38.7 kph (24.2 mph)
- 1992 3983km, (2489m); 198 starters, 130 finishers (66%); Winner: Miguel INDURAIN, 28, avg: 39.5 kph (24.7 mph)
- 1991 3914km, (2446m); 198 starters, 158 finishers (80%); Winner: Miguel INDURAIN, 27, avg: 38.7 kph (24.2 mph)
- 1990 3504km, (2190m); 198 starters, 156 finishers (79%); Winner: Greg LEMOND, 29, avg: 38.6 kph (24.1 mph)
- 1989 3285km, (2053m); 198 starters, 138 finishers (70%); Winner: Greg LEMOND, 28, avg: 37.5 kph (23.4 mph)
- 1988 3286km, (2054m); 198 starters, 151 finishers (76%); Winner: Pedro DELGADO, 28, avg: 38.9 kph (24.3 mph)
- 1987 4231km, (2644m); 207 starters, 135 finishers (65%); Winner: Stephen ROCHE, 28, avg: 36.6 kph (22.9 mph)
- 1986 4094km, (2559m); 210 starters, 132 finishers (63%); Winner: Greg LEMOND, 25, avg: 37 kph (23.1 mph)
- 1985 4109km, (2568m); 180 starters, 144 finishers (80%); Winner: Bernard HINAULT, 31, avg: 36.2 kph (22.6 mph)
- 1984 4021km, (2513m); 170 starters, 124 finishers (73%); Winner: Laurent FIGNON, 24, avg: 35.9 kph (22.4 mph)
- 1983 3809km, (2381m); 140 starters, 88 finishers (63%); Winner: Laurent FIGNON, 23, avg: 36.2 kph (22.6 mph)
- 1982 3507km, (2192m); 169 starters, 125 finishers (74%); Winner: Bernard HINAULT, 28, avg: 38.1 kph (23.8 mph)
- 1981 3753km, (2346m); 150 starters, 121 finishers (81%); Winner: Bernard HINAULT, 27, avg: 39 kph (24.4 mph)
- 1980 3842km, (2401m); 130 starters, 85 finishers (65%); Winner: Joop ZOETEMELK, 34, avg: 35.1 kph (22 mph)
- 1979 3765km, (2353m); 150 starters, 90 finishers (60%); Winner: Bernard HINAULT, 25, avg: 36.5 kph (22.8 mph)
- 1978 3908km, (2443m); 110 starters, 78 finishers (71%); Winner: Bernard HINAULT, 24, avg: 36.1 kph (22.6 mph)
- 1977 4096km, (2560m); 100 starters, 53 finishers (53%); Winner: Bernard THÉVENET, 29, avg: 35.4 kph (22.1 mph)
- 1976 4017km, (2511m); 130 starters, 87 finishers (67%); Winner: Lucien VAN IMPE, 30, avg: 34.5 kph (21.6 mph)
- 1975 4000km, (2500m); 140 starters, 86 finishers (61%); Winner: Bernard THÉVENET, 27, avg: 34.9 kph (21.8 mph)
- 1974 4098km, (2561m); 130 starters, 105 finishers (81%); Winner: Eddy MERCKX, 29, avg: 35.2 kph (22 mph)
- 1973 4090km, (2556m); 132 starters, 87 finishers (66%); Winner: Luis OCANA, 28, avg: 33.4 kph (20.9 mph)
- 1972 3846km, (2404m); 132 starters, 88 finishers (67%); Winner: Eddy MERCKX, 27, avg: 35.5 kph (22.2 mph)
- 1971 3608km, (2255m); 130 starters, 94 finishers (72%); Winner: Eddy MERCKX, 26, avg: 38.1 kph (23.8 mph)
- 1970 4254km, (2659m); 150 starters, 100 finishers (67%); Winner: Eddy MERCKX, 25, avg: 35.6 kph (22.2 mph)
- 1969 4117km, (2573m); 130 starters, 86 finishers (66%); Winner: Eddy MERCKX, 24, avg: 35.4 kph (22.1 mph)
- 1968 4492km, (2808m); 110 starters, 63 finishers (57%); Winner: Jan JANSSEN, 28, avg: 33.6 kph (21 mph)
- 1967 4779km, (2987m); 130 starters, 88 finishers (68%); Winner: Roger PINGEON, 27, avg: 34.8 kph (21.7 mph)
- 1966 4329km, (2706m); 130 starters, 82 finishers (63%); Winner: Lucien AIMAR, 25, avg: 36.8 kph (23 mph)
- 1965 4188km, (2618m); 130 starters, 96 finishers (74%); Winner: Felice GIMONDI, 23, avg: 35.9 kph (22.4 mph)
- 1964 4504km, (2815m); 132 starters, 81 finishers (61%); Winner: Jacques ANQUETIL, 30, avg: 35.4 kph (22.1 mph)
- 1963 4138km, (2586m); 130 starters, 76 finishers (58%); Winner: Jacques ANQUETIL, 29, avg: 37.1 kph (23.2 mph)
- 1962 4274km, (2671m); 149 starters, 94 finishers (63%); Winner: Jacques ANQUETIL, 28, avg: 37.3 kph (23.3 mph)
- 1961 4397km, (2748m); 132 starters, 72 finishers (55%); Winner: Jacques ANQUETIL, 27, avg: 36 kph (22.5 mph)
- 1960 4173km, (2608m); 128 starters, 81 finishers (63%); Winner: Gastone NENCINI, 30, avg: 37.2 kph (23.3 mph)
- 1959 4358km, (2724m); 120 starters, 65 finishers (54%); Winner: Federico BAHAMONTES, 31, avg: 35.5 kph (22.2 mph)
- 1958 4319km, (2699m); 120 starters, 78 finishers (65%); Winner: Charly GAUL, 26, avg: 36.9 kph (23.1 mph)
- 1957 4669km, (2918m); 120 starters, 56 finishers (47%); Winner: Jacques ANQUETIL, 23, avg: 34.5 kph (21.6 mph)
- 1956 4498km, (2811m); 120 starters, 88 finishers (73%); Winner: Roger WALKOWIAK, 29, avg: 36.3 kph (22.7 mph)
- 1955 4495km, (2809m); 130 starters, 69 finishers (53%); Winner: Louison BOBET, 30, avg: 34.4 kph (21.5 mph)
- 1954 4656km, (2910m); 110 starters, 69 finishers (63%); Winner: Louison BOBET, 29, avg: 33.2 kph (20.8 mph)
- 1953 4476km, (2798m); 119 starters, 76 finishers (64%); Winner: Louison BOBET, 28, avg: 34.6 kph (21.6 mph)
- 1952 4898km, (3061m); 122 starters, 78 finishers (64%); Winner: Fausto COPPI, 33, avg: 32.2 kph (20.1 mph)
- 1951 4690km, (2931m); 123 starters, 66 finishers (54%); Winner: Hugo KOBLET, 26, avg: 32.9 kph (20.6 mph)
- 1950 4773km, (2983m); 116 starters, 51 finishers (44%); Winner: Ferdi KÜBLER, 31, avg: 32.8 kph (20.5 mph)
- 1949 4808km, (3005m); 120 starters, 55 finishers (46%); Winner: Fausto COPPI, 30, avg: 32.1 kph (20.1 mph)
- 1948 4922km, (3076m); 120 starters, 44 finishers (37%); Winner: Gino BARTALI, 34, avg: 33.4 kph (20.9 mph)
- 1947 4642km, (2901m); 100 starters, 53 finishers (53%); Winner: Jean ROBIC, 26, avg: 31.4 kph (19.6 mph)
- 1939 4224km, (2640m); 79 starters, 49 finishers (62%); Winner: Sylvère MAES, 30, avg: 32 kph (20 mph)
- 1938 4694km, (2934m); 96 starters, 55 finishers (57%); Winner: Gino BARTALI, 24, avg: 31.6 kph (19.7 mph)
- 1937 4415km, (2759m); 98 starters, 46 finishers (47%); Winner: Roger LAPÉPIE, 26, avg: 31.8 kph (19.9 mph)
- 1936 4442km, (2776m); 90 starters, 43 finishers (48%); Winner: Sylvère MAES, 27, avg: 31.1 kph (19.4 mph)
- 1935 4338km, (2711m); 93 starters, 46 finishers (49%); Winner: Romain MAES, 22, avg: 30.7 kph (19.2 mph)
- 1934 4470km, (2794m); 60 starters, 39 finishers (65%); Winner: Antonin MAGNE, 30, avg: 30.4 kph (19 mph)
- 1933 4395km, (2747m); 80 starters, 40 finishers (50%); Winner: Georges SPEICHER, 26, avg: 29.8 kph (18.6 mph)
- 1932 4479km, (2799m); 80 starters, 57 finishers (71%); Winner: André LEDUCQ, 28, avg: 29 kph (18.2 mph)
- 1931 5091km, (3182m); 81 starters, 35 finishers (43%); Winner: Antonin MAGNE, 27, avg: 28.7 kph (18 mph)
- 1930 4822km, (3014m); 100 starters, 59 finishers (59%); Winner: André LEDUCQ, 26, avg: 28 kph (17.5 mph)
- 1929 5286km, (3304m); 155 starters, 60 finishers (39%); Winner: Maurice DEWAELE, 33, avg: 28.3 kph (17.7 mph)
- 1928 5476km, (3423m); 162 starters, 41 finishers (25%); Winner: Nicolas FRANTZ, 29, avg: 28.4 kph (17.8 mph)
- 1927 5398km, (3374m); 142 starters, 39 finishers (27%); Winner: Nicolas FRANTZ, 28, avg: 27.2 kph (17 mph)
- 1926 5745km, (3591m); 126 starters, 41 finishers (33%); Winner: Lucien BUYSSE, 34, avg: 24.3 kph (15.2 mph)
- 1925 5440km, (3400m); 130 starters, 49 finishers (38%); Winner: Ottavio BOTTECCHIA, 31, avg: 24.8 kph (15.5 mph)
- 1924 5425km, (3391m); 157 starters, 60 finishers (38%); Winner: Ottavio BOTTECCHIA, 30, avg: 24.3 kph (15.2 mph)
- 1923 5386km, (3366m); 139 starters, 48 finishers (35%); Winner: Henri PÉLISSIER, 33, avg: 24.2 kph (15.1 mph)
- 1922 5375km, (3359m); 121 starters, 38 finishers (31%); Winner: Firmin LAMBOT, 36, avg: 24.2 kph (15.1 mph)
- 1921 5485km, (3428m); 123 starters, 38 finishers (31%); Winner: Léon SCIEUR, 33, avg: 24.7 kph (15.5 mph)
- 1920 5503km, (3439m); 113 starters, 22 finishers (19%); Winner: Philippe THYS, 30, avg: 24.1 kph (15 mph)
- 1919 5560km, (3475m); 69 starters, 11 finishers (16%); Winner: Firmin LAMBOT, 33, avg: 24.1 kph (15 mph)
- 1914 5380km, (3363m); 145 starters, 54 finishers (37%); Winner: Philippe THYS, 24, avg: 26.8 kph (16.8 mph)
- 1913 5287km, (3304m); 140 starters, 25 finishers (18%); Winner: Philippe THYS, 23, avg: 26.7 kph (16.7 mph)
- 1912 5289km, (3306m); 131 starters, 41 finishers (31%); Winner: Odile DEFRAYE, 24, avg: 27.8 kph (17.4 mph)
- 1911 5343km, (3339m); 84 starters, 28 finishers (33%); Winner: Gustave GARRIGOU, 27, avg: 27.3 kph (17.1 mph)
- 1910 4734km, (2959m); 110 starters, 41 finishers (37%); Winner: Octave LAPIZE, 21, avg: 29.1 kph (18.2 mph)
- 1909 4497km, (2811m); 150 starters, 55 finishers (37%); Winner: François FABER, 22, avg: 28.7 kph (17.9 mph)
- 1908 4488km, (2805m); 112 starters, 36 finishers (32%); Winner: Lucien PETIT-BRETON, 25, avg: 28.7 kph (18 mph)
- 1907 4488km, (2805m); 93 starters, 33 finishers (35%); Winner: Lucien PETIT-BRETON, 24, avg: 28.5 kph (17.8 mph)
- 1906 4637km, (2898m); 82 starters, 14 finishers (17%); Winner: René POTTIER, 27, avg: 24.5 kph (15.3 mph)
- 1905 2994km, (1871m); 60 starters, 24 finishers (40%); Winner: Louis TROUSSELIER, 24, avg: 27.1 kph (16.9 mph)
- 1904 2428km, (1518m); 88 starters, 27 finishers (31%); Winner: Henri CORNET, 20, avg: 25.3 kph (15.8 mph)
- 1903 2428km, (1518m); 60 starters, 21 finishers (35%); Winner: Maurice GARIN, 32, avg: 25.7 kph (16 mph)
Popular on Velo
\n >\", \"path\": \"https:\/\/velo.outsideonline.com\/road\/road-racing\/cycling-sucks-sometimes-what-pogacar-van-der-poel-and-pidcock-said-before-liege-bastogne-liege\/\", \"listing_type\": \"recirc\", \"location\": \"list\", \"title\": \"\u2018cycling sucks sometimes\u2019: what poga\u010dar, van der poel and pidcock said before li\u00e8ge-bastogne-li\u00e8ge\"}}\u0027>\n \u2018cycling sucks sometimes\u2019: what poga\u010dar, van der poel and pidcock said before li\u00e8ge-bastogne-li\u00e8ge\n \n \n \n \n \n\n \n \n \n \n \n\n \n "},{"title":"\u2018hard miles\u2019 wants to be the first great bicycling movie since \u2018breaking away\u2019","url":"https:\/\/velo.outsideonline.com\/news\/hard-miles-wants-to-be-the-first-great-bicycling-movie-since-breaking-away\/","markup":" \n \n\n\n \n\n \n \n >\", \"path\": \"https:\/\/velo.outsideonline.com\/news\/hard-miles-wants-to-be-the-first-great-bicycling-movie-since-breaking-away\/\", \"listing_type\": \"recirc\", \"location\": \"list\", \"title\": \"\u2018hard miles\u2019 wants to be the first great bicycling movie since \u2018breaking away\u2019\"}}\u0027>\n \n \n \n \n \n \n\n \n \n\n \n\n \n \n\n \n \n >\", \"path\": \"https:\/\/velo.outsideonline.com\/news\/hard-miles-wants-to-be-the-first-great-bicycling-movie-since-breaking-away\/\", \"listing_type\": \"recirc\", \"location\": \"list\", \"title\": \"\u2018hard miles\u2019 wants to be the first great bicycling movie since \u2018breaking away\u2019\"}}\u0027>\n \u2018hard miles\u2019 wants to be the first great bicycling movie since \u2018breaking away\u2019\n \n \n \n \n \n\n \n \n \n \n \n\n \n "},{"title":"tom pidcock leaves li\u00e8ge in frustration: \u2018i was setting all-time power numbers\u2019","url":"https:\/\/velo.outsideonline.com\/road\/road-racing\/tom-pidcock-leaves-liege-in-frustration-i-was-setting-all-time-power-numbers\/","markup":" \n \n\n\n \n\n \n \n >\", \"path\": \"https:\/\/velo.outsideonline.com\/road\/road-racing\/tom-pidcock-leaves-liege-in-frustration-i-was-setting-all-time-power-numbers\/\", \"listing_type\": \"recirc\", \"location\": \"list\", \"title\": \"tom pidcock leaves li\u00e8ge in frustration: \u2018i was setting all-time power numbers\u2019\"}}\u0027>\n \n \n \n \n \n \n\n \n \n\n \n\n \n \n\n \n \n >\", \"path\": \"https:\/\/velo.outsideonline.com\/road\/road-racing\/tom-pidcock-leaves-liege-in-frustration-i-was-setting-all-time-power-numbers\/\", \"listing_type\": \"recirc\", \"location\": \"list\", \"title\": \"tom pidcock leaves li\u00e8ge in frustration: \u2018i was setting all-time power numbers\u2019\"}}\u0027>\n tom pidcock leaves li\u00e8ge in frustration: \u2018i was setting all-time power numbers\u2019\n \n \n \n \n \n\n \n \n \n \n \n\n \n "},{"title":"xpedo\u2019s new power meter pedals are ready for the spotlight","url":"https:\/\/velo.outsideonline.com\/road\/road-gear\/xpedo-new-power-sonik-omni-and-thrust-omni-meter-pedals-sea-otter-classic\/","markup":" \n \n\n\n \n\n \n \n >\", \"path\": \"https:\/\/velo.outsideonline.com\/road\/road-gear\/xpedo-new-power-sonik-omni-and-thrust-omni-meter-pedals-sea-otter-classic\/\", \"listing_type\": \"recirc\", \"location\": \"list\", \"title\": \"xpedo\u2019s new power meter pedals are ready for the spotlight\"}}\u0027>\n \n \n \n \n \n \n\n \n \n\n \n\n \n \n\n \n \n >\", \"path\": \"https:\/\/velo.outsideonline.com\/road\/road-gear\/xpedo-new-power-sonik-omni-and-thrust-omni-meter-pedals-sea-otter-classic\/\", \"listing_type\": \"recirc\", \"location\": \"list\", \"title\": \"xpedo\u2019s new power meter pedals are ready for the spotlight\"}}\u0027>\n xpedo\u2019s new power meter pedals are ready for the spotlight\n \n \n \n \n \n\n \n \n \n \n \n\n \n "},{"title":"the thesis n1 wants to be your sole drop bar bike for everything","url":"https:\/\/velo.outsideonline.com\/gravel\/gravel-gear\/thesis-n1-do-everything-drop-bar-bike\/","markup":" \n \n\n\n \n\n \n \n >\", \"path\": \"https:\/\/velo.outsideonline.com\/gravel\/gravel-gear\/thesis-n1-do-everything-drop-bar-bike\/\", \"listing_type\": \"recirc\", \"location\": \"list\", \"title\": \"the thesis n1 wants to be your sole drop bar bike for everything\"}}\u0027>\n \n \n \n \n \n \n\n \n \n\n \n\n \n \n\n \n \n >\", \"path\": \"https:\/\/velo.outsideonline.com\/gravel\/gravel-gear\/thesis-n1-do-everything-drop-bar-bike\/\", \"listing_type\": \"recirc\", \"location\": \"list\", \"title\": \"the thesis n1 wants to be your sole drop bar bike for everything\"}}\u0027>\n the thesis n1 wants to be your sole drop bar bike for everything\n \n \n \n \n \n\n \n \n \n \n \n\n \n "},{"title":"results: keegan swenson and sofia gomez villafa\u00f1e win the fuego xl at sea otter classic","url":"https:\/\/velo.outsideonline.com\/news\/fuego-xl-sea-otter-results\/","markup":" \n \n\n\n \n\n \n \n >\", \"path\": \"https:\/\/velo.outsideonline.com\/news\/fuego-xl-sea-otter-results\/\", \"listing_type\": \"recirc\", \"location\": \"list\", \"title\": \"results: keegan swenson and sofia gomez villafa\u00f1e win the fuego xl at sea otter classic\"}}\u0027>\n \n \n \n \n \n \n\n \n \n\n \n\n \n \n\n \n \n >\", \"path\": \"https:\/\/velo.outsideonline.com\/news\/fuego-xl-sea-otter-results\/\", \"listing_type\": \"recirc\", \"location\": \"list\", \"title\": \"results: keegan swenson and sofia gomez villafa\u00f1e win the fuego xl at sea otter classic\"}}\u0027>\n results: keegan swenson and sofia gomez villafa\u00f1e win the fuego xl at sea otter classic\n \n \n \n \n \n\n \n \n \n \n \n\n \n "},{"title":"mathieu van der poel realistic about quest for monument sweep: \u2018even with roubaix legs i cannot follow poga\u010dar\u2019","url":"https:\/\/velo.outsideonline.com\/road\/road-racing\/mathieu-van-der-poel-realistic-about-quest-for-fourth-monument-even-with-roubaix-legs-i-cannot-follow-pogacar-here\/","markup":" \n \n\n\n \n\n \n \n >\", \"path\": \"https:\/\/velo.outsideonline.com\/road\/road-racing\/mathieu-van-der-poel-realistic-about-quest-for-fourth-monument-even-with-roubaix-legs-i-cannot-follow-pogacar-here\/\", \"listing_type\": \"recirc\", \"location\": \"list\", \"title\": \"mathieu van der poel realistic about quest for monument sweep: \u2018even with roubaix legs i cannot follow poga\u010dar\u2019\"}}\u0027>\n \n \n \n \n \n \n\n \n \n\n \n\n \n \n\n \n \n >\", \"path\": \"https:\/\/velo.outsideonline.com\/road\/road-racing\/mathieu-van-der-poel-realistic-about-quest-for-fourth-monument-even-with-roubaix-legs-i-cannot-follow-pogacar-here\/\", \"listing_type\": \"recirc\", \"location\": \"list\", \"title\": \"mathieu van der poel realistic about quest for monument sweep: \u2018even with roubaix legs i cannot follow poga\u010dar\u2019\"}}\u0027>\n mathieu van der poel realistic about quest for monument sweep: \u2018even with roubaix legs i cannot follow poga\u010dar\u2019\n \n \n \n \n \n\n \n \n \n \n \n\n \n "},{"title":"the cadex race integrated bar is as light as it is good looking","url":"https:\/\/velo.outsideonline.com\/road\/road-gear\/cadex-race-integrated-bar-first-look\/","markup":" \n \n\n\n \n\n \n \n >\", \"path\": \"https:\/\/velo.outsideonline.com\/road\/road-gear\/cadex-race-integrated-bar-first-look\/\", \"listing_type\": \"recirc\", \"location\": \"list\", \"title\": \"the cadex race integrated bar is as light as it is good looking\"}}\u0027>\n \n \n \n \n \n \n\n \n \n\n \n\n \n \n\n \n \n >\", \"path\": \"https:\/\/velo.outsideonline.com\/road\/road-gear\/cadex-race-integrated-bar-first-look\/\", \"listing_type\": \"recirc\", \"location\": \"list\", \"title\": \"the cadex race integrated bar is as light as it is good looking\"}}\u0027>\n the cadex race integrated bar is as light as it is good looking\n \n \n \n \n \n\n \n \n \n \n \n\n \n "},{"title":"time to plan your next trip: 5 companies with new bike bags at sea otter","url":"https:\/\/velo.outsideonline.com\/gravel\/gravel-gear\/new-bike-bags-at-this-years-sea-otter\/","markup":" \n \n\n\n \n\n \n \n >\", \"path\": \"https:\/\/velo.outsideonline.com\/gravel\/gravel-gear\/new-bike-bags-at-this-years-sea-otter\/\", \"listing_type\": \"recirc\", \"location\": \"list\", \"title\": \"time to plan your next trip: 5 companies with new bike bags at sea otter\"}}\u0027>\n \n \n \n \n \n \n\n \n \n\n \n\n \n \n\n \n \n >\", \"path\": \"https:\/\/velo.outsideonline.com\/gravel\/gravel-gear\/new-bike-bags-at-this-years-sea-otter\/\", \"listing_type\": \"recirc\", \"location\": \"list\", \"title\": \"time to plan your next trip: 5 companies with new bike bags at sea otter\"}}\u0027>\n time to plan your next trip: 5 companies with new bike bags at sea otter\n \n \n \n \n \n\n \n \n \n \n \n\n \n "},{"title":"new titanium brand chandi brings decades of frame building experience to its beautiful bikes","url":"https:\/\/velo.outsideonline.com\/road\/road-gear\/new-titanium-brand-chandi-brings-decades-of-frame-building-experience-to-its-beautiful-bikes\/","markup":" \n \n\n\n \n\n \n \n >\", \"path\": \"https:\/\/velo.outsideonline.com\/road\/road-gear\/new-titanium-brand-chandi-brings-decades-of-frame-building-experience-to-its-beautiful-bikes\/\", \"listing_type\": \"recirc\", \"location\": \"list\", \"title\": \"new titanium brand chandi brings decades of frame building experience to its beautiful bikes\"}}\u0027>\n \n \n \n \n \n \n\n \n \n\n \n\n \n \n\n \n \n >\", \"path\": \"https:\/\/velo.outsideonline.com\/road\/road-gear\/new-titanium-brand-chandi-brings-decades-of-frame-building-experience-to-its-beautiful-bikes\/\", \"listing_type\": \"recirc\", \"location\": \"list\", \"title\": \"new titanium brand chandi brings decades of frame building experience to its beautiful bikes\"}}\u0027>\n new titanium brand chandi brings decades of frame building experience to its beautiful bikes\n \n \n \n \n \n\n \n \n \n \n \n\n \n "},{"title":"ride the rockies canceled for 2024, future uncertain","url":"https:\/\/velo.outsideonline.com\/news\/ride-the-rockies-canceled-due-to-low-registration-future-uncertain\/","markup":" \n \n\n\n \n\n \n \n >\", \"path\": \"https:\/\/velo.outsideonline.com\/news\/ride-the-rockies-canceled-due-to-low-registration-future-uncertain\/\", \"listing_type\": \"recirc\", \"location\": \"list\", \"title\": \"ride the rockies canceled for 2024, future uncertain\"}}\u0027>\n \n \n \n \n \n \n\n \n \n\n \n\n \n \n\n \n \n >\", \"path\": \"https:\/\/velo.outsideonline.com\/news\/ride-the-rockies-canceled-due-to-low-registration-future-uncertain\/\", \"listing_type\": \"recirc\", \"location\": \"list\", \"title\": \"ride the rockies canceled for 2024, future uncertain\"}}\u0027>\n ride the rockies canceled for 2024, future uncertain\n \n \n \n \n \n\n \n \n \n \n \n\n \n "},{"title":"sea otter randoms: riser handlebars, nifty racks, and tubes aren\u2019t dead","url":"https:\/\/velo.outsideonline.com\/news\/sea-otter-randoms-riser-handlebars-nifty-racks-and-tubes-arent-dead\/","markup":" \n \n\n\n \n\n \n \n >\", \"path\": \"https:\/\/velo.outsideonline.com\/news\/sea-otter-randoms-riser-handlebars-nifty-racks-and-tubes-arent-dead\/\", \"listing_type\": \"recirc\", \"location\": \"list\", \"title\": \"sea otter randoms: riser handlebars, nifty racks, and tubes aren\u2019t dead\"}}\u0027>\n \n \n \n \n \n \n\n \n \n\n \n\n \n \n\n \n \n >\", \"path\": \"https:\/\/velo.outsideonline.com\/news\/sea-otter-randoms-riser-handlebars-nifty-racks-and-tubes-arent-dead\/\", \"listing_type\": \"recirc\", \"location\": \"list\", \"title\": \"sea otter randoms: riser handlebars, nifty racks, and tubes aren\u2019t dead\"}}\u0027>\n sea otter randoms: riser handlebars, nifty racks, and tubes aren\u2019t dead\n \n \n \n \n \n\n \n \n \n \n \n\n \n "},{"title":"tadej poga\u010dar seizes li\u00e8ge-bastogne-li\u00e8ge with dominant solo display","url":"https:\/\/velo.outsideonline.com\/road\/road-racing\/tadej-pogacar-seizes-liege-bastogne-liege-with-dominant-solo-display\/","markup":" \n \n\n\n \n\n \n \n >\", \"path\": \"https:\/\/velo.outsideonline.com\/road\/road-racing\/tadej-pogacar-seizes-liege-bastogne-liege-with-dominant-solo-display\/\", \"listing_type\": \"recirc\", \"location\": \"list\", \"title\": \"tadej poga\u010dar seizes li\u00e8ge-bastogne-li\u00e8ge with dominant solo display\"}}\u0027>\n \n \n \n \n \n \n\n \n \n\n \n\n \n \n\n \n \n >\", \"path\": \"https:\/\/velo.outsideonline.com\/road\/road-racing\/tadej-pogacar-seizes-liege-bastogne-liege-with-dominant-solo-display\/\", \"listing_type\": \"recirc\", \"location\": \"list\", \"title\": \"tadej poga\u010dar seizes li\u00e8ge-bastogne-li\u00e8ge with dominant solo display\"}}\u0027>\n tadej poga\u010dar seizes li\u00e8ge-bastogne-li\u00e8ge with dominant solo display\n \n \n \n \n \n\n \n \n \n \n \n\n \n "},{"title":"trek launches carback radar rear bike light with 2 km daytime visibility","url":"https:\/\/velo.outsideonline.com\/news\/trek-carback-radar-rear-bike-light-challenges-garmin\/","markup":" \n \n\n\n \n\n \n \n >\", \"path\": \"https:\/\/velo.outsideonline.com\/news\/trek-carback-radar-rear-bike-light-challenges-garmin\/\", \"listing_type\": \"recirc\", \"location\": \"list\", \"title\": \"trek launches carback radar rear bike light with 2 km daytime visibility\"}}\u0027>\n \n \n \n \n \n \n\n \n \n\n \n\n \n \n\n \n \n >\", \"path\": \"https:\/\/velo.outsideonline.com\/news\/trek-carback-radar-rear-bike-light-challenges-garmin\/\", \"listing_type\": \"recirc\", \"location\": \"list\", \"title\": \"trek launches carback radar rear bike light with 2 km daytime visibility\"}}\u0027>\n trek launches carback radar rear bike light with 2 km daytime visibility\n \n \n \n \n \n\n \n \n \n \n \n\n \n "},{"title":"the ritchey montebello brings steel goodness to all-road","url":"https:\/\/velo.outsideonline.com\/road\/road-gear\/ritchey-montebello-brings-steel-goodness-to-all-road\/","markup":" \n \n\n\n \n\n \n \n >\", \"path\": \"https:\/\/velo.outsideonline.com\/road\/road-gear\/ritchey-montebello-brings-steel-goodness-to-all-road\/\", \"listing_type\": \"recirc\", \"location\": \"list\", \"title\": \"the ritchey montebello brings steel goodness to all-road\"}}\u0027>\n \n \n \n \n \n \n\n \n \n\n \n\n \n \n\n \n \n >\", \"path\": \"https:\/\/velo.outsideonline.com\/road\/road-gear\/ritchey-montebello-brings-steel-goodness-to-all-road\/\", \"listing_type\": \"recirc\", \"location\": \"list\", \"title\": \"the ritchey montebello brings steel goodness to all-road\"}}\u0027>\n the ritchey montebello brings steel goodness to all-road\n \n \n \n \n \n\n \n \n \n \n \n\n \n "},{"title":"highbar wants to revolutionize your helmet straps","url":"https:\/\/velo.outsideonline.com\/news\/highbar-wants-to-revolutionize-your-helmet-straps\/","markup":" \n \n\n\n \n\n \n \n >\", \"path\": \"https:\/\/velo.outsideonline.com\/news\/highbar-wants-to-revolutionize-your-helmet-straps\/\", \"listing_type\": \"recirc\", \"location\": \"list\", \"title\": \"highbar wants to revolutionize your helmet straps\"}}\u0027>\n \n \n \n \n \n \n\n \n \n\n \n\n \n \n\n \n \n >\", \"path\": \"https:\/\/velo.outsideonline.com\/news\/highbar-wants-to-revolutionize-your-helmet-straps\/\", \"listing_type\": \"recirc\", \"location\": \"list\", \"title\": \"highbar wants to revolutionize your helmet straps\"}}\u0027>\n highbar wants to revolutionize your helmet straps\n \n \n \n \n \n\n \n \n \n \n \n\n \n "},{"title":"haro bikes is set to release a new race road bike and gravel bike. wait, what","url":"https:\/\/velo.outsideonline.com\/road\/road-gear\/haro-buzzard-rivette-road-gravel\/","markup":" \n \n\n\n \n\n \n \n >\", \"path\": \"https:\/\/velo.outsideonline.com\/road\/road-gear\/haro-buzzard-rivette-road-gravel\/\", \"listing_type\": \"recirc\", \"location\": \"list\", \"title\": \"haro bikes is set to release a new race road bike and gravel bike. wait, what\"}}\u0027>\n \n \n \n \n \n \n\n \n \n\n \n\n \n \n\n \n \n >\", \"path\": \"https:\/\/velo.outsideonline.com\/road\/road-gear\/haro-buzzard-rivette-road-gravel\/\", \"listing_type\": \"recirc\", \"location\": \"list\", \"title\": \"haro bikes is set to release a new race road bike and gravel bike. wait, what\"}}\u0027>\n haro bikes is set to release a new race road bike and gravel bike. wait, what\n \n \n \n \n \n\n \n \n \n \n \n\n \n "},{"title":"key takeaways: li\u00e8ge-bastogne-li\u00e8ge 2024","url":"https:\/\/velo.outsideonline.com\/road\/road-racing\/key-takeaways-liege-bastogne-liege-2024\/","markup":" \n \n\n\n \n\n \n \n >\", \"path\": \"https:\/\/velo.outsideonline.com\/road\/road-racing\/key-takeaways-liege-bastogne-liege-2024\/\", \"listing_type\": \"recirc\", \"location\": \"list\", \"title\": \"key takeaways: li\u00e8ge-bastogne-li\u00e8ge 2024\"}}\u0027>\n \n \n \n \n \n \n\n \n \n\n \n\n \n \n\n \n \n >\", \"path\": \"https:\/\/velo.outsideonline.com\/road\/road-racing\/key-takeaways-liege-bastogne-liege-2024\/\", \"listing_type\": \"recirc\", \"location\": \"list\", \"title\": \"key takeaways: li\u00e8ge-bastogne-li\u00e8ge 2024\"}}\u0027>\n key takeaways: li\u00e8ge-bastogne-li\u00e8ge 2024\n \n \n \n \n \n\n \n \n \n \n \n\n \n "},{"title":"kona bikes bails on sea otter classic with no explanation","url":"https:\/\/velo.outsideonline.com\/news\/kona-bikes-bails-on-sea-otter-classic-with-no-explanation\/","markup":" \n \n\n\n \n\n \n \n >\", \"path\": \"https:\/\/velo.outsideonline.com\/news\/kona-bikes-bails-on-sea-otter-classic-with-no-explanation\/\", \"listing_type\": \"recirc\", \"location\": \"list\", \"title\": \"kona bikes bails on sea otter classic with no explanation\"}}\u0027>\n \n \n \n \n \n \n\n \n \n\n \n\n \n \n\n \n \n >\", \"path\": \"https:\/\/velo.outsideonline.com\/news\/kona-bikes-bails-on-sea-otter-classic-with-no-explanation\/\", \"listing_type\": \"recirc\", \"location\": \"list\", \"title\": \"kona bikes bails on sea otter classic with no explanation\"}}\u0027>\n kona bikes bails on sea otter classic with no explanation\n \n \n \n \n \n\n \n \n \n \n \n\n \n "},{"title":"sea otter randoms: limited edition saddle, updated ritte, salsa e-bike and more","url":"https:\/\/velo.outsideonline.com\/road\/road-gear\/sea-otter-randoms-limited-edition-saddle-updated-ritte-salsa-e-bike-and-more\/","markup":" \n \n\n\n \n\n \n \n >\", \"path\": \"https:\/\/velo.outsideonline.com\/road\/road-gear\/sea-otter-randoms-limited-edition-saddle-updated-ritte-salsa-e-bike-and-more\/\", \"listing_type\": \"recirc\", \"location\": \"list\", \"title\": \"sea otter randoms: limited edition saddle, updated ritte, salsa e-bike and more\"}}\u0027>\n \n \n \n \n \n \n\n \n \n\n \n\n \n \n\n \n \n >\", \"path\": \"https:\/\/velo.outsideonline.com\/road\/road-gear\/sea-otter-randoms-limited-edition-saddle-updated-ritte-salsa-e-bike-and-more\/\", \"listing_type\": \"recirc\", \"location\": \"list\", \"title\": \"sea otter randoms: limited edition saddle, updated ritte, salsa e-bike and more\"}}\u0027>\n sea otter randoms: limited edition saddle, updated ritte, salsa e-bike and more\n \n \n \n \n \n\n \n \n \n \n \n\n \n "}]' > >", "name": "footer-menu", "type": "link"}}'>advertise >", "name": "footer-menu", "type": "link"}}'>privacy policy >", "name": "footer-menu", "type": "link"}}'>contact >", "name": "footer-menu", "type": "link"}}'>careers >", "name": "footer-menu", "type": "link"}}'>terms of use >", "name": "footer-menu", "type": "link"}}'>site map >", "name": "footer-menu", "type": "link"}}'>my newsletters manage cookie preferences privacy request healthy living.
- Clean Eating
- Vegetarian Times
- Yoga Journal
- Fly Fishing Film Tour
- National Park Trips
- Warren Miller
- Fastest Known Time
- Trail Runner
- Women's Running
- Bicycle Retailer & Industry News
- FinisherPix
- Outside Events Cycling Series
- Outside Shop
© 2024 Outside Interactive, Inc
Tour de France Statistics: Dates, Stages, Average Speed, Length, Number of Entrants and Finishers

Bill & Carol McGann's book The Story of the Tour de France, Vol 1: 1903 - 1975 is available as an audiobook here . Or, for the print and eBook versions, just click on the link to the right.
Here is a listing of the dates of each Tour with the starting (until 1952, it was always Paris) and finishing city (always Paris), the total length of each Tour, number of stages, the number of entrants and finishers as well as the winner's average speed over the entire Tour.
Click on any highlighted year for much more information about that Tour
The distances and average speeds for pre-World War I Tour are very inexact.
Back then stage lengths were often estimated.
Tour de France Winners, Podium and Times as well as links to all other Tour de France information on our site
Other competitions (points, KOM, green jersey, team classification)
Tour de France prizes, winners and total prize pools, by year
No Tours were held from 1915-1918 and 1940-1946.

Content continues below the ads
© McGann Publishing
Five moments that defined the 2022 Tour de France
From Roglic's crash to the Pyrenean power play, we dissect a spectacular edition of the Grande Boucle

As always, it was a Tour de France of a thousand stories, from Fabio Jakobsen’s emotional win in Nybørg to Michael Mørkøv’s doomed but noble effort to finish inside the time limit at Carcassonne; from Michael Matthews’ craft at Mende to Tom Pidcock’s drifting descent of the Galibier.
Run off at an average speed in excess of 42km, the 2022 Tour de France was the fastest in history, and it exacted a brutal toll on its participants. COVID-19 contributed to the rate of attrition, but so too did the searing heat and relentless nature of the racing. Just 135 riders made it to Paris, the lowest number of finishers since 2000.
There were compelling performances from men like Geraint Thomas , who placed third after what was perhaps the most complete Tour he has even ridden, or Romain Bardet, who battled gamely either side of a dreaded jour sans in the Pyrenees. David Gaudu began to deliver on his considerable promise with a fine 4th place finish in Paris.
As the Tour drew on, however, it became increasingly clear that the race for yellow was again a straight fight between Tadej Pogačar and the Jumbo-Visma collective. In 2020 and 2021, Pogacar had the better of that contest. This time out, the team in yellow and black had his number, as Jonas Vingegaard emerged to claim Denmark’s second overall title after Bjarne Riis in 1996.
Cyclingnews looks back at some of the moments that defined his victory.
Roglič’s crash on the road to Arenberg

It’s not quite Tom Brady and Drew Bledsoe, but would Jonas Vingegaard have risen to become a Tour winner so soon without the misfortune that has befallen his Jumbo-Visma teammate Primož Roglič on this race?
A year ago, Roglič’s early crash left an opening for Vingegaard to step up unexpectedly as team leader. This time out, Roglič’s fall on stage 5 changed the dynamic at Jumbo in a way that allowed Vingegaard to go on and win the race.
Get The Leadout Newsletter
The latest race content, interviews, features, reviews and expert buying guides, direct to your inbox!
Roglič and Vingegaard set out from Copenhagen as near co-leaders, though Jumbo-Visma’s configuration at the Critérium du Dauphiné suggested that the Slovenian remained half a step ahead in the hierarchy. If Roglič and Vingegaard had both reached the mountains locked on the same time, Jumbo-Visma may well have elected to ride cautiously in the Alps to keep both their contenders in the hunt.
Instead, the complexion of Jumbo-Visma’s Tour was shifted by a loose bale of hay on a roundabout 30km or so from the finish of stage 5 in Arenberg. Roglič had successfully navigated six sectors of cobbles – more successfully than Vingegaard, who was chasing furiously at that point – but he was among the unfortunate fallers. Roglič dislocated his shoulder in the crash, and he was forced to pop it back in himself before remounting. Somehow, he limited his losses to 3 minutes – not enough to save his Tour ambitions, but just enough to force Pogačar to keep him under observation.
Roglič’s misfortune was the headline story from a tumultuous day on the cobbles, but, in hindsight, Jumbo-Visma’s rescue operation for Vingegaard was also pivotal. The Dane’s calamitous, three-part bike change looked to have torpedoed his chances, but Wout van Aert helped to stitch him back into the race for the yellow jersey, just as Roglič’s challenge was unravelling.
Going long at Longwy

There was a time when riding the Tour was an exercise in saving energy. Writing in Cycle Sport in the 1990s, Philippa York wrote a Tour rider’s survival guide that included the immortal maxim: "Never stand when you can sit, never sit when you can lie down."
On the road, general classification contenders also meted their efforts out carefully in the opening phase, picking and choosing when to strike later on. Key climbing domestiques, too, were generally ordered to sit up where possible.
All of that appears to have gone out the window in recent seasons, at least in some specific cases. Van Aert’s all-action Tour not only saw him win three stages and the green jersey, he was also Vingegaard’s key domestique in the mountains of the third week. Yet despite that hefty workload, he saw little reason to spare himself when he spent four days in yellow in the opening week.
On stage 6 to Longwy, Van Aert took the radical step of defending his yellow jersey by going on the attack from the very start of the day. Behind, there was an ecstasy of fumbling to get on his wheel. Undeterred, Van Aert simply kept on accelerating for over an hour, stringing out the bunch until they eventually relented after 80km or so and he got his way. The Belgian would burn off his breakaway companions Jakob Fulgsang and Quinn Simmons before he was eventually reeled in by a splintered bunch on the hilly finale.
Van Aert lost seven minutes and yellow that day, but he couched his move as a sacrifice on behalf of his team, who hadn’t been charged with controlling what was always likely to be an unruly stage.
Pogačar’s UAE Team Emirates squad instead took up the reins on the run-in, and the Slovenian delivered a long, long sprint to beat his friend Michael Matthews to the line. A day earlier, Pogačar had attacked on the cobbles and 24 hours later, he would outlast Vingegaard on La Planche des Belles Filles. Like Van Aert, saving energy didn’t seem to figure in Pogačar’s thinking at this Tour, an approach that would prove costly.
Pogačar cracks on the Col du Granon

The account was ultimately settled on the Col du Granon, but Pogačar’s costly bill was run up on the Col du Galibier. The defending champion, as we saw, had made no concession to sparing himself in week one, and he saw no reason to start when Jumbo-Visma’s duo of leaders began attacking him in turns with 60km left in stage 11.
Rather than allow Roglič, almost three minutes down overall, even an inch of leeway, Pogačar immediately shut down his move, and he was obliged to do likewise when Vingegaard entered the fray shortly afterwards. By then, Pogačar’s UAE Team Emirates guard had already been distanced by the accelerations, but the yellow jersey didn’t seem unduly concerned. Instead, he joined happily in the strongest man competition, responding to Jumbo’s tag-team efforts with digs of his own.
It was like trying to calm a storm by shouting over it, yet for a time it worked. Only Vingegaard could hold Pogačar’s wheel over the Galibier. Even in the next valley, when the front group swelled and Pogačar was outnumbered by five Jumbo jerseys, it still felt like the Slovenian could defend his maillot jaune alone all the way to Paris, like Horatius at the bridge. As if to hammer home the idea, Pogačar smilingly made light of the intensity of the stage when the television motorbike drifted by.
On the upper reaches of the Col du Granon, that levity gave way to a leaden pedal stroke. Not even the presence of Rafal Majka could help Pogačar, who buckled under the weight of Vingegaard’s acceleration with 5km to go. He would lose 2:51 by the summit, together with his yellow jersey and his air of invulnerability.
The Tour had changed utterly.
Pyrenean power plays

Both Jumbo-Visma and UAE Team Emirates were depleted come the final week of the Tour. COVID-19 had entered the UAE camp, leaving just four men standing by the start of stage 17, while Jumbo lost Roglič and Kruijswijk on one fraught day on stage 15.
That afternoon in Carcassonne, UAE manager Mauro Gianetti downplayed the impact of absent teammates on the final week. "The Tour will be decided by the leaders on the big mountains, not by their teams," Gianetti said. He wasn’t exactly right, but he wasn’t entirely wrong either.
As it turned out, teammates did play a significant role in the troika of stages in the Pyrenees, even if the Tour was by this point, of course, a straight duel between Vingegaard and Pogačar. Athletes of the pedigree of Thomas, Gaudu and Bardet, who all rode fine Tours - perhaps the best of their careers - were no longer in the same postcode as the men ahead of them. Jumbo and UAE were in a race of their own, as they had been from Copenhagen.
On the opening Pyrenean leg to Foix, Jumbo-Visma looked to nullify any late Pogačar offensive by depositing Van Aert in the early break, a tactic they would revisit two days later on the road to Hautacam. In between, Pogačar’s grand offensive came on stage 17, where the rouleur Mikkel Bjerg discovered hitherto unseen wings to shred the yellow jersey group at the foot of the Col du Val Louron-Azet, before Brandon McNulty took over, with only Pogačar and Vingegaard able to follow.
Pogačar outsprinted Vingegaard to claw back four bonus seconds at the finish in Peyragudes, a meagre return on the energy invested. Perhaps it was telling that Pogačar elected to stay on McNulty’s wheel throughout the raid, aside from a short dig over the top of the penultimate climb. It felt like a tacit admission that Vingegaard was the strongest man on show.
Pogačar being Pogačar, he summoned up a volley of attacks on the penultimate climb of the Tour the next day, but Vingegaard was again implacable on the Col des Spandelles. Pogačar’s crash on the descent, meanwhile, effectively ended the Tour as a contest, even if there was now one more show of force from Jumbo-Visma as they teed up Vingegaard for stage victory at Hautacam.
Van Aert had attacked from kilometre zero and spent the day on the front of the race, but he somehow still had enough force left to take up pace-making duties when Vingegaard and Pogačar bridged up to him with a little over 5km remaining. Barely a mile later, one of the best sprinters in the world had dropped the man who had won the previous two Tours.
Questions worth asking

Jumbo-Visma’s supremacy was total on this Tour. Vingegaard won the race and the king of the mountains title. Van Aert landed the green jersey with a record tally and was elected the Tour’s most combative rider. The Dutch squad won six stages, across all terrains.
Faced with such dominance, it is reasonable to ask questions, even if – as Michael Rasmussen pointed out – good answers are unlikely to be forthcoming through the medium of the press conference. Still, the Tour winners of the recent past have usually understood the drill. The Tour is a bellwether for the health of cycling, and the credibility of the maillot jaune is emblematic of the probity of the sport as a whole.
Vingegaard, like others before him, accepted the premise when faced with the question in his press conference in Gramat on Saturday evening. The gist of his answer – "trust us, we’re clean" – may have been light on detail, but at least the Dane understood that doping in cycling is an issue that always warrants discussion.
The reaction of his teammate Van Aert, on the other hand, was lamentable. Asked about the credibility of Jumbo’s performances, the Belgian complained huffily about what he deemed to be a "shit question". He should know that scepticism is only to be expected in the face of extraordinary performances. The onus is on him and his team to offer enough transparency to assuage those concerns. In that light, Van Aert’s eventual response – "We worked super hard for this, and cycling has changed" – was, if he will pardon the expression, a shit answer.
But it is true, too, that some constructive questions should be directed elsewhere, most notably to the UCI. In the 18 months since the UCI put doping controls in the hands of the ITA, not a single rider has tested positive in the men’s WorldTour. Does this mean doping has been eradicated or is the testing simply not adequate?
And what of the biological passport, which has not successfully prosecuted a WorldTour rider in years? Is the testing regime fit for purpose? Europol, who coordinated searches of Bahrain Victorious before the Tour, are among those who appear to have their doubts.
Until those issues are addressed, then questions like those fielded by Van Aert and Vingegaard on Saturday evening will inevitably – and rightly – continue for the Tour winners of the future.

Thank you for reading 5 articles in the past 30 days*
Join now for unlimited access
Enjoy your first month for just £1 / $1 / €1
*Read any 5 articles for free in each 30-day period, this automatically resets
After your trial you will be billed £4.99 $7.99 €5.99 per month, cancel anytime. Or sign up for one year for just £49 $79 €59

Try your first month for just £1 / $1 / €1

Barry Ryan is Head of Features at Cyclingnews. He has covered professional cycling since 2010, reporting from the Tour de France, Giro d’Italia and events from Argentina to Japan. His writing has appeared in The Independent, Procycling and Cycling Plus. He is the author of The Ascent: Sean Kelly, Stephen Roche and the Rise of Irish Cycling’s Golden Generation , published by Gill Books.
Best cycling trousers of 2024: Six options so you can ride to work and not get changed
Tadej Pogačar can dominate the Giro d’Italia but nobody can control its chaos – Analysis
Itzulia Women
Most Popular
- Topics ›
- Tour de France ›
The Countries Dominating the Tour de France
The 2023 Tour de France stopped rolling yesterday, with Denmark's Jonas Vingegaard once again taking the prestigious lion on the Champs Elysees. At 26, Vingegaard, who also won last year, has given Denmark its third Tour victory.
As this infographic shows, French participants are the cyclists to have won the Tour de France the most times since its inception in 1903, with 36 overall victories. It is worth mentioning that, naturally, most of the participants were French during the first years of the competition.
Belgium, with 18 final victories occupies the second position in the ranking. Spain and Italy are the only other countries to register wins in the double figures. When it comes to individual cyclists , four are tied on the most general classification wins: two of which are French, one Spanish and one Belgian.
Description
This chart shows the Tour de France winners from 1903 to 2023, by cyclist nationality.
Can I integrate infographics into my blog or website?
Yes, Statista allows the easy integration of many infographics on other websites. Simply copy the HTML code that is shown for the relevant statistic in order to integrate it. Our standard is 660 pixels, but you can customize how the statistic is displayed to suit your site by setting the width and the display size. Please note that the code must be integrated into the HTML code (not only the text) for WordPress pages and other CMS sites.

Infographic Newsletter
Statista offers daily infographics about trending topics, covering: Economy & Finance , Politics & Society , Tech & Media , Health & Environment , Consumer , Sports and many more.
Related Infographics
Tour de france, has pro cycling cleaned up its act, where cycling has an uphill battle for fans, americans lose interest in post-armstrong tour de france, fortnite world champion bags $3 million prize, tour de france: the 20-year fight against doping, how esport prize purses compare to traditional sports, can the tour de france shake its tarnished past.
- Who may use the "Chart of the Day"? The Statista "Chart of the Day", made available under the Creative Commons License CC BY-ND 3.0, may be used and displayed without charge by all commercial and non-commercial websites. Use is, however, only permitted with proper attribution to Statista. When publishing one of these graphics, please include a backlink to the respective infographic URL. More Information
- Which topics are covered by the "Chart of the Day"? The Statista "Chart of the Day" currently focuses on two sectors: "Media and Technology", updated daily and featuring the latest statistics from the media, internet, telecommunications and consumer electronics industries; and "Economy and Society", which current data from the United States and around the world relating to economic and political issues as well as sports and entertainment.
- Does Statista also create infographics in a customized design? For individual content and infographics in your Corporate Design, please visit our agency website www.statista.design
Any more questions?
Get in touch with us quickly and easily. we are happy to help.
Feel free to contact us anytime using our contact form or visit our FAQ page .
Statista Content & Design
Need infographics, animated videos, presentations, data research or social media charts?
More Information
The Statista Infographic Newsletter
Receive a new up-to-date issue every day for free.
- Our infographics team prepares current information in a clear and understandable format
- Relevant facts covering media, economy, e-commerce, and FMCG topics
- Use our newsletter overview to manage the topics that you have subscribed to
Tour de France Time Trial Winners’ Average Speed
The time trial (TT) is a special discipline where the riders use a time trial bike to compete instead of their regular road bike. Within the time trial, there are sub-disciplines, such as the Individual time trial (ITT) and the Team time trial (TTT).
#TDF2023 ⏱️ It's time trial day on Stage 16. 🚀 Here are the 3 fastest ITTs above 10km at the Tour de France 🇫🇷. 2015 (13.5km): Rohan Dennis 🇦🇺, 55.446km/h 1989 (24.5km): Greg Lemond 🇺🇸, 54.545km/h 2005 (49km): David Millar 🏴, 54.361km/h — Mr. Mamil (@MrMamil) July 18, 2023
Fastest Individual Time Trial (above 10km) average speed
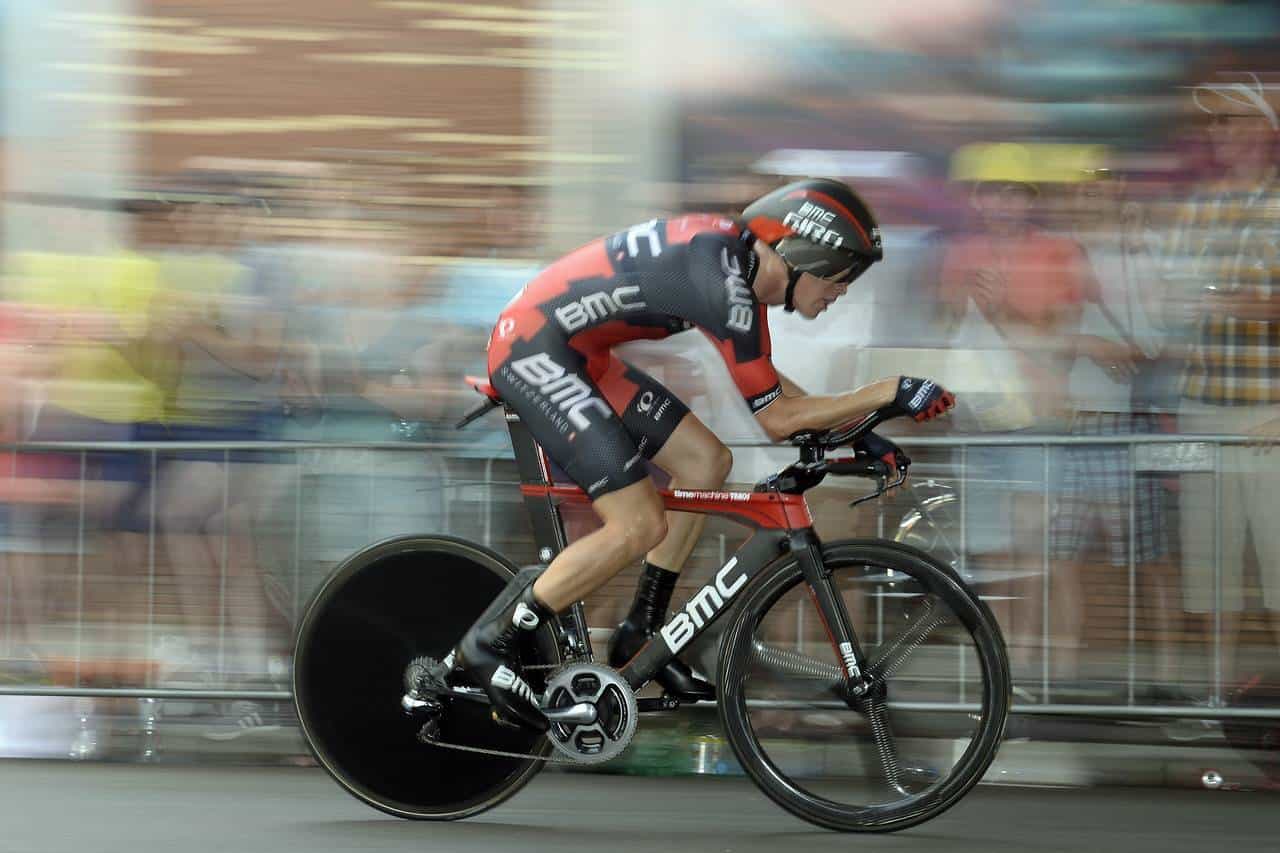
Individual Time Trial (ITT) is competed individually with no drafting allowed. Riders are flagged off between 60 to 90 seconds apart, with the last rider on the General Classification to start first.
The Tour de France would feature at least an ITT stage depending on the year and route. In some years, it would feature a combination of a prologue, ITT, and TTT. In 2012, there were two ITT stages and a prologue, which had a total of 101km (63.3 miles) of time trailing. This puts Bradley Wiggins as the favorite to win as he’s a very strong time trialist compared to his nearest competitors.
In the past five editions, the time trial has been reduced to a total distance below 60km (37.5 miles) which is advantageous to pure climbers. In 2020, there was only one ITT, and it was a mountain time trial up La Planche des Belles Filles where Primoz Roglic cracked, and Tadej Pogačar overtook him to win his first Tour de France.
Eight of the top 10 fastest average speeds occurred after the year 2000. This can be attributed to the advancements in aerodynamics and bike technologies in recent years.
Rohan Dennis holds the fastest Individual Time Trial average speed at 55.446kph in 2015. He finished the 13.8km route in 14’16”.
Fastest Individual Time Trial / Prologue (below 10km) average speed
A prologue is a very short time trial below 10km and usually sees speeds above 50km/h.
Chris Boardman holds the fastest prologue average speed of 55.152km/h for the 1994 stage in Lille. He finished the 7.2km stage in 7’49”, 15 seconds ahead of second-place Miguel Indurain.
The last Tour de Frace prologue was held in 2012 at Liège, Belgium. Fabian Cancellara finished the 6.4km (4 miles) route in 7’13” with an average speed of 53.210km/h, putting this ride the fifth fastest of all time.
Fastest Team Time Trial average speed
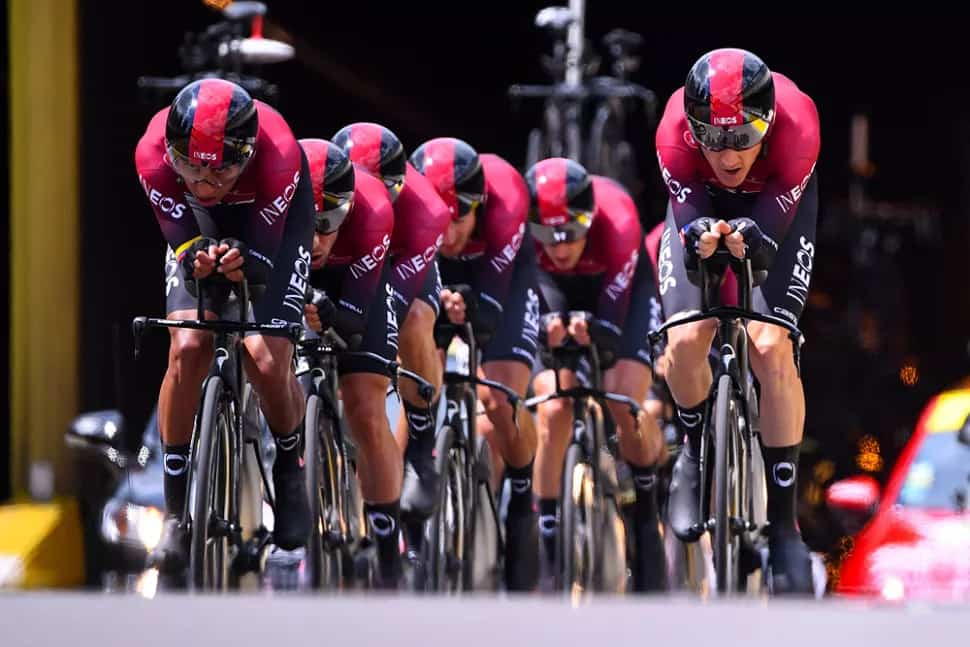
The Team Time Trial (TTT) is competed by the entire team. Riders are allowed to draft each other for maximum aerodynamic benefits. It’s a joy to watch, especially with a well-oiled team that makes it look effortless.
The main challenge of TTT is race pacing and planning. Each rider in the team has their strengths and weaknesses. One main challenge is finding the right balance between speed and effort to play to the time trialists’ strengths while minimizing the time losses for the climbers.
The finishing time is taken when the fifth rider passes the finishing line,
The last three TTT were held on Stage 2 in 2019, stage 3 in 2018, and Stage 9 in 2015.
Orica GreenEDGE set the fastest ever TTT average speed of 57.841km/h, finishing 25km in 25’56”, 1 second ahead of Omega Pharma-Quick-Step and 2 seconds ahead of Team Sky.
Tour de France Race Guide
2023 Tour de France on TV Broadcasts Availability
2023 Tour de France Prize Money Breakdown
How is the 2023 Tour de France Time Limit Calculated?
What is the meaning of Tour de France Jersey Colors?
Why is the Tour de France So Popular?

Alex Lee is the founder and editor-at-large of Mr. Mamil. Coming from a professional engineering background, he breaks down technical cycling nuances into an easy-to-understand and digestible format here.
He has been riding road bikes actively for the past 12 years and started racing competitively in the senior category during the summer recently.
Mr. Mamil's content is for educational and entertainment purposes only. The content is not a substitute for official or professional advice. Please do your own due diligence.
Mr. Mamil participates in the Amazon Services LLC Associates Program, an affiliate advertising program designed to provide a means for us to earn fees by linking to Amazon.com and affiliated sites. We also participate in various other affiliate programs, and at times we earn a commission through purchases made through links on this website.
Privacy Policy
Website Terms
© Mr. Mamil, 2023
IMAGES
VIDEO
COMMENTS
In 2023, the winner of the Tour de France, Jonas Vingegaard, maintained an average speed of around 41.43 kilometers per hour. The Danish cyclist also won the famous event in 2022, with an average ...
The slowest Tour de France was the edition of 1919, when Firmin Lambot's average speed was 24.1 km/h. Stage speeds The fastest ... The youngest Tour de France stage winner is Fabio Battesini, who was 19 when he won stage 3 in the 1931 Tour de France.
For many of those early years, average speeds hovered around 25 kilometers per hour, with individual stages often taking several hours to complete. The winner of the very first 1903 Tour de France achieved only 25.7 km/h average speed, while the slowest race was just 24.1 km/h in 1919. In the early years of the Tour, the sport was very much one ...
This post analyzes the average speeds of riders in the Tour de France cycling race over the years. It looks at speed records, factors that influence speed like bike technology, racing strategies, and course profiles. Data on historic average speeds is presented along with insights into how rider training and equipment innovation have contributed to increases in speed over the decades.
Details on speed records from famous Tour de France stages and comparisons to how fast top professional cycling teams can ride on flat and uphill terrain. A look at the training, equipment, and tactics that allow cyclists to push their limits and achieve what seems superhuman on a bicycle. ... Winner Average Speed (mph) 2022: Jonas Vingegaard ...
The average speed for professional cyclists while traversing on flat terrain is 25-28 mph. The average amateur cyclist travels about 17-18 mph while on flat ground. For many pro athletes racing in the Tour de France, being able to maintain a fast speed on flat terrain allows them to simply stay competitive with the other athletes.
Tour de France | areppim's chart of Tour de France winners average speeds. The average speed reached by the winners of the Tour de France increased by 53.9% since the first race in 1903 through 2016. This means an average speed increase rate of 0.42% each Tour. The upward trend reached its peak at 41.65 km/h with the 7th consecutive win by the ...
The general trend at the Tour de France, since its start in 1903, is that the speed of the riders is going up ... Tour de France average speed (last 11 editions) 2009, Alberto Contador: 40.03km/h ...
The early years of the Tour de France were characterised by lengthy stages often exceeding 400 km, rudimentary bicycles, and rugged roads, which resulted in a slow pace compared to today's standards. Maurice Garin, the winner of the first Tour in 1903, achieved an average speed of 25.7 km/h, or approximately 16 mph.
Tour statistics (dates, distances, average speed, etc.) Tour de France prizes, winners and total prize pools, by year. From 1930 to 1961 plus 1967 and 1968, national and regional rather than trade teams competed. On October 22, 2012 Lance Armstrong was stripped of his seven Tour victories. Content continues below the ads. Year.
Laurent Fignon became the youngest winner of the Tour de France for 50 years (Image credit: ... Highest average speed of Tour winner 41.654kph: Lance Armstrong (USA) - 2005
Average speed per stage. The average speed over all stages is 41.408 km/hour. The average speed for the whole race is computed by dividing the total distance by the sum of stage times of the final GC winner. In the last column the average speed up to that stage is shown. This is the average speed for the leader in the race at that stage. Stage.
The average Tour de France speed of all editions is 34.62 km/h. The average speed was 27.67 km/h between 1919 and 1939, and 40.15 km/h between 1999 and 2019. ... Tour de France winners have an average BMI of 21.70. The Tour de France winner with the highest BMI was François Faber.
A Tour de France soigneur might mix between 40 and 120 bottles for the team on each stage, which means an individual rider may throw back up to a dozen bottles or more. Average Rider: 1 to 2 Tour ...
Tour de France winners and their average speeds. 2011 3431km (5489.6m),180 starters, 167 finishers (93%); Winner: Cadel EVANS, 34, avg: 39.8 kph (24.9 mph) 2010 3642km (5827.2m),180 starters, 170 finishers (94%); Winner: Alberto CONTADOR, 27, avg: 39.6 kph (24.7 mph) 2009 3459km (5534.4m),180 starters, 156 finishers (87%); Winner: Alberto ...
Tour de France Statistics: Dates, Stages, Average Speed, Length, Number of Entrants and Finishers. Bill & Carol McGann's book The Story of the Tour de France, Vol 1: 1903 - 1975 is available as an audiobook here. Or, for the print and eBook versions, just click on the link to the right.
The quickest time trial was earned by Rohan Dennis during the first stage of the 2015 Tour de France in Utrecht, who triumphed with an average speed of 55.5 km/h (34.5 mph). The 2013 Orica GreenEDGE team holds the record for the fastest stage win in a team time trial. They impressively covered a 25 km time trial at 57.70 km/h.
Helyett - 3 wins. La Sportive - 3 wins. Tour de France winning bikes by year. Throughout 110 editions (up to 2023), the Tour de France has been won by 36 different bike brands. Many of these brands are unknown to cycling fans today. Few bike brands, such as Colnago, Pinarello, Specialized, and Trek, are synonymous with cycling fans today.
Run off at an average speed in excess of 42km, the 2022 Tour de France was the fastest in history, and it exacted a brutal toll on its participants. ... the Tour winners of the recent past have ...
This chart shows the Tour de France winners from 1903 to 2023, by cyclist nationality. ... Winner average speed in the Tour de France 1903-2023. Tour de France riders with the most stage wins 1903 ...
A prologue is a very short time trial below 10km and usually sees speeds above 50km/h. Chris Boardman holds the fastest prologue average speed of 55.152km/h for the 1994 stage in Lille. He finished the 7.2km stage in 7'49", 15 seconds ahead of second-place Miguel Indurain. The last Tour de Frace prologue was held in 2012 at Liège, Belgium.