

Latency vs Round Trip Time: Understanding the Differences

As someone who works in the technology industry, I often come across the terms “latency” and “round trip time” (RTT). While both terms are related to network performance, they are not interchangeable.
Understanding latency and RTT is crucial for troubleshooting network issues and improving network performance. In this article, I will explain latency and RTT and how they differ.
Table of Contents
What is Latency?
Latency refers to the time it takes for a packet of data to travel from its source to its destination . It’s the measure of how long it takes for a packet to travel from one point to another. Latency is often measured in milliseconds (ms), and the lower the latency, the better the network performance.
Many factors can affect latency, including the distance between the source and destination, the number of hops the packet must take, and the network’s speed. For example, if you’re sending a packet from New York to Los Angeles, it will take longer for the packet to travel that distance than if you’re sending it from New York to Boston.
Similarly, if the packet must pass through multiple routers or switches, it will take longer to reach its destination than if it only had to pass through one.
What is Round Trip Time?
Round trip time, or RTT, measures the time it takes for a packet to travel from its source to its destination and then back again . It’s time it takes for a packet to make a round trip. RTT is also measured in milliseconds (ms), and like latency, the lower the RTT, the better the network performance.
RTT is affected by the same factors that affect latency, including distance, number of hops, and network speed. However, RTT also considers the time it takes for the destination to process the packet and send a response.
For example, if you’re sending a packet to a server that’s busy processing other requests, it will take longer for the server to respond, and thus, the RTT will be higher.
Differences between Latency and RTT
The main difference between latency and RTT is that latency only measures the time it takes for a packet to travel from its source to its destination, while RTT measures the time it takes for a packet to make a round trip.
Latency measures the time it takes for a packet to travel from one point to another. It’s the measure of one-way delay. RTT measures the time it takes for a packet to travel from its source to its destination and back again. It’s the measure of two-way delay.
Another important difference is that while latency only measures the time it takes for a packet to travel from one point to another, RTT considers the time it takes for the destination to process the packet and send a response.
For example, if you’re trying to access a website, the latency will measure the time it takes for the packet to travel from your computer to the server hosting it. The RTT will measure the time it takes for the packet to travel from your computer to the server hosting the website and back to the webpage.
Latency and RTT are network performance measures, but they measure differently. Latency measures the time it takes for a packet to travel from one point to another, while RTT measures the time it takes for a packet to make a round trip.
Understanding the difference between these two terms is crucial for troubleshooting network issues and improving network performance.
How to Measure Latency and RTT?
Several tools and methods can be used to measure latency and RTT. One of the most common tools is the ping command. The ping command sends a packet to a specified destination and measures the time it takes for the packet to return. The ping command can be used to measure both latency and RTT.
Another tool that can be used to measure latency and RTT is traceroute. Traceroute works by sending packets to a specified destination and measuring the time it takes for each packet to reach each hop along the way.
It also provides information about each hop, such as IP address and hostname. This tool is useful for identifying the source of network issues, as it can show where packets are getting delayed.
There are also specialized tools and services, such as Speedtest and Cloudping, that can be used to measure network performance. These tools typically provide more detailed information about network performance, such as upload and download speeds, and can be used to compare network performance between different locations and providers.
What are Some Ways to Improve Latency and RTT?
There are several ways to improve latency and RTT, but it’s important to understand that not all solutions will work in all situations. The most effective solutions will depend on the specific network and the root cause of the latency or RTT issues.
One common solution is to upgrade network hardware, such as routers and switches . This can improve network speed and reduce the number of hops packets must take, thereby reducing latency and RTT.
Another solution is to optimize network configurations. This can include optimizing routing protocols and adjusting packet size. This can help to improve network efficiency and reduce the number of hops packets must take, thereby reducing latency and RTT.
Optimizing network software and applications can also help to improve network performance. This can include optimizing web servers, databases, and other applications to reduce the time it takes for the destination to process packets and send a response.
Finally, it’s also essential to consider the physical location of network devices. For example, if devices are located in a poorly ventilated area, they may overheat and become less efficient, resulting in increased latency and RTT.
By moving the devices to a cooler location or adding additional cooling, the devices will be able to run more efficiently, which can help to improve network performance.
Latency and RTT are both important network performance measures, but they measure different things. Latency measures the time it takes for a packet to travel from one point to another, while RTT measures the time it takes for a packet to make a round trip.
Understanding these two terms’ differences is crucial for troubleshooting network issues and improving network performance. Several tools and methods can be used to measure latency and RTT.
There are several ways to improve network performance, such as upgrading network hardware, optimizing network configurations, optimizing network software and applications, and considering the physical location of network devices.
Frequently Asked Questions
Why is it important to understand the difference between latency and rtt.
Understanding latency and RTT is crucial for troubleshooting network issues and improving network performance. Latency and RTT are network performance measures, but they measure differently.
By understanding the difference between these two terms, you can better understand where network issues are occurring and implement solutions to improve performance.
Can latency and RTT be reduced to zero?
It’s impossible to reduce latency and RTT to zero, as there will always be some delay due to the physical distance between the source and destination.
However, latency and RTT can be minimized through various methods such as upgrading network hardware, optimizing network configurations, and reducing the number of hops packets must take.
Can you give an example of a situation where latency is more important than RTT?
One example of a situation where latency is more critical than RTT is in online gaming . When playing a game online, players expect a low latency to ensure that their actions are responsive and they have the best gaming experience.
In this case, it’s more important to minimize the time it takes for a packet to travel from the player’s computer to the game server than to measure the time it takes for a packet to make a round trip.
Related Posts

Spectrum Modem Blinking Blue And White: How to Fix
Gpu artifacts: causes, solutions, and prevention.

How Is A Microprocessor Different From An Integrated Circuit

MSI vs Lenovo: A Comprehensive Comparison for Tech Enthusiasts

How Much Do Laptops Weigh? A Comprehensive Guide

Is It Bad To Sleep With AirPods In?

Tim has always been obsessed with computers his whole life. After working for 25 years in the computer and electronics field, he now enjoys writing about computers to help others. Most of his time is spent in front of his computer or other technology to continue to learn more. He likes to try new things and keep up with the latest industry trends so he can share them with others.
Leave a Comment Cancel reply
Save my name, email, and website in this browser for the next time I comment.

Home > Learning Center > Round Trip Time (RTT)
Article's content
Round trip time (rtt), what is round trip time.
Round-trip time (RTT) is the duration, measured in milliseconds, from when a browser sends a request to when it receives a response from a server. It’s a key performance metric for web applications and one of the main factors, along with Time to First Byte (TTFB), when measuring page load time and network latency .
Using a Ping to Measure Round Trip Time
RTT is typically measured using a ping — a command-line tool that bounces a request off a server and calculates the time taken to reach a user device. Actual RTT may be higher than that measured by the ping due to server throttling and network congestion.

Example of a ping to google.com
Factors Influencing RTT
Actual round trip time can be influenced by:
- Distance – The length a signal has to travel correlates with the time taken for a request to reach a server and a response to reach a browser.
- Transmission medium – The medium used to route a signal (e.g., copper wire, fiber optic cables) can impact how quickly a request is received by a server and routed back to a user.
- Number of network hops – Intermediate routers or servers take time to process a signal, increasing RTT. The more hops a signal has to travel through, the higher the RTT.
- Traffic levels – RTT typically increases when a network is congested with high levels of traffic. Conversely, low traffic times can result in decreased RTT.
- Server response time – The time taken for a target server to respond to a request depends on its processing capacity, the number of requests being handled and the nature of the request (i.e., how much server-side work is required). A longer server response time increases RTT.
See how Imperva CDN can help you with website performance.
Reducing RTT Using a CDN
A CDN is a network of strategically placed servers, each holding a copy of a website’s content. It’s able to address the factors influencing RTT in the following ways:
- Points of Presence (PoPs) – A CDN maintains a network of geographically dispersed PoPs—data centers, each containing cached copies of site content, which are responsible for communicating with site visitors in their vicinity. They reduce the distance a signal has to travel and the number of network hops needed to reach a server.
- Web caching – A CDN caches HTML, media, and even dynamically generated content on a PoP in a user’s geographical vicinity. In many cases, a user’s request can be addressed by a local PoP and does not need to travel to an origin server, thereby reducing RTT.
- Load distribution – During high traffic times, CDNs route requests through backup servers with lower network congestion, speeding up server response time and reducing RTT.
- Scalability – A CDN service operates in the cloud, enabling high scalability and the ability to process a near limitless number of user requests. This eliminates the possibility of server side bottlenecks.

Using tier 1 access to reduce network hops
One of the original issues CDNs were designed to solve was how to reduce round trip time. By addressing the points outlined above, they have been largely successful, and it’s now reasonable to expect a decrease in your RTT of 50% or more after onboarding a CDN service.
Latest Blogs

Grainne McKeever
Feb 26, 2024 3 min read

Erez Hasson
Jan 18, 2024 3 min read

Luke Richardson
Dec 27, 2023 6 min read

Dec 21, 2023 2 min read

Dec 13, 2023 5 min read

Dec 7, 2023 6 min read

- Imperva Threat Research

, Gabi Stapel
Nov 8, 2023 13 min read

Nov 7, 2023 1 min read
Latest Articles
- Network Management
169.8k Views
164.9k Views
152.9k Views
100.4k Views
98.3k Views
58.7k Views
54.6k Views
2024 Bad Bot Report
Bad bots now represent almost one-third of all internet traffic
The State of API Security in 2024
Learn about the current API threat landscape and the key security insights for 2024
Protect Against Business Logic Abuse
Identify key capabilities to prevent attacks targeting your business logic
The State of Security Within eCommerce in 2022
Learn how automated threats and API attacks on retailers are increasing
Prevoty is now part of the Imperva Runtime Protection
Protection against zero-day attacks
No tuning, highly-accurate out-of-the-box
Effective against OWASP top 10 vulnerabilities
An Imperva security specialist will contact you shortly.
Top 3 US Retailer
Written by Vasilena Markova • September 27, 2023 • 12:58 pm • Internet
Round-Trip Time (RTT): What It Is and Why It Matters
Round-Trip Time (RTT) is a fundamental metric in the context of network performance, measuring the time it takes for data packets to complete a round trip from source to destination and back. Often expressed in milliseconds (ms), RTT serves as a critical indicator for evaluating the efficiency and reliability of network connections. In today’s article, we dive into the concept of RTT, exploring how it works, why it matters in our digital lives, the factors that influence it, and strategies to enhance it. Whether you’re a casual internet user seeking a smoother online experience or a network administrator aiming to optimize your digital infrastructure, understanding this metric is critical in today’s interconnected world.
Table of Contents
What is Round-Trip Time (RTT)?
Round-Trip Time is a network performance metric representing the time it takes for a data packet to travel from the source to the destination and back to the source. It is often measured in milliseconds (ms) and is a crucial parameter for determining the quality and efficiency of network connections.
To understand the concept of RTT, imagine sending a letter to a friend through the postal service. The time it takes for the letter to reach your friend and for your friend to send a reply back to you forms the Round-Trip Time for your communication. Similarly, in computer networks, data packets are like those letters, and RTT represents the time it takes for them to complete a round trip.
How Does it Work?
The concept of RTT can be best understood by considering the journey of data packets across a network. When you request information from a web server, for example, your device sends out a data packet holding your request. This packet travels through various network devices in between, such as routers and switches, before reaching the destination server. Once the server processes your request and prepares a response, it sends a data packet back to your device.
Round-Trip Time is determined by the time it takes for this data packet to travel from your device to the server (the outbound trip) and then back from the server to your device (the inbound trip). The total RTT is the sum of these two one-way trips.
Let’s break down the journey of a data packet into several steps so you can better understand the RTT:
- Sending the Packet: You initiate an action on your device that requires data transmission. For example, this could be sending an email, loading a webpage, or making a video call.
- Packet Travel: The data packet travels from your device to a server, typically passing through multiple network nodes and routers along the way. These middle points play a significant role in determining the RTT.
- Processing Time: The server receives the packet, processes the request, and sends a response back to your device. This processing time at both ends also contributes to the Round-Trip Time.
- Return Journey: The response packet makes its way back to your device through the same network infrastructure, facing potential delays on the route.
- Calculation: It is calculated by adding up the time taken for the packet to travel from your device to the server (the outbound trip) and the time it takes for the response to return (the inbound trip).
Why does it matter?
At first look, Round-Trip Time (RTT) might seem like technical terminology, but its importance extends to various aspects of our digital lives. It matters for many reasons, which include the following:
- User Experience
For everyday internet users, RTT influences the sensed speed and responsiveness of online activities. Low Round-Trip Time values lead to a seamless experience, while high RTT can result in frustrating delays and lag during tasks like video streaming, online gaming, or live chats.
- Network Efficiency
Network administrators and service providers closely monitor RTT to assess network performance and troubleshoot issues. By identifying bottlenecks and areas with high RTT, they can optimize their infrastructure for better efficiency.
- Real-Time Applications
Applications that rely on real-time data transmission, such as VoIP calls, video conferencing, and online gaming, are highly sensitive to RTT. Low RTT is crucial for smooth, interruption-free interactions.
In cybersecurity, Round-Trip Time plays a role in detecting network anomalies and potential threats. Unusually high RTT values can be a sign of malicious activity or network congestion.
Factors Affecting Round-Trip Time (RTT)
Several factors can influence the metric, both positively and negatively. Therefore, understanding these factors is crucial, and it could be very beneficial for optimizing network performance:
- Distance: The physical distance between the source and destination plays a significant role. Longer distances result in higher RTT due to the time it takes for data to travel the network.
- Network Congestion: When a network experiences high volumes of traffic or congestion, data packets may be delayed as they wait for their turn to be processed. As a result, it can lead to packet delays and increased RTT.
- Routing: The path a packet takes through the network can significantly affect RTT. Efficient routing algorithms can reduce the time, while not-so-optimal routing choices can increase it.
- Packet Loss: Packet loss during transmission can occur due to various reasons, such as network errors or congestion. When lost, packets need to be retransmitted, which can seriously affect the Round-Trip Time.
- Transmission Medium: It is a critical factor influencing RTT, and its characteristics can vary widely based on the specific medium being used. Fiber optic cables generally offer low RTT due to the speed of light in the medium and low signal loss. In contrast, wireless mediums can introduce variable delays depending on environmental factors and network conditions.
How to improve it?
Improving Round-Trip Time (RTT) is a critical goal for network administrators and service providers looking to enhance user experiences and optimize their digital operations. While some factors affecting it are beyond our control, there are strategies and practices to optimize Round-Trip Time for a smoother online experience:
- Optimize Routing: Network administrators can optimize routing to reduce the number of hops data packets take to reach their destination. This can be achieved through efficient routing protocols and load balancing .
- Optimize Network Infrastructure: For businesses, investing in efficient network infrastructure, including high-performance routers and switches, can reduce internal network delays and improve RTT.
- Upgrade Hardware and Software: Keeping networking equipment and software up-to-date ensures that you benefit from the latest technologies and optimizations that can decrease RTT.
- Implement Caching: Caching frequently requested data closer to end-users can dramatically reduce the need for data to travel long distances. The result really helps with lowering RTT.
- Monitor and Troubleshoot: Regularly monitor your network for signs of congestion or packet loss. If issues arise, take steps to troubleshoot and resolve them promptly.
Discover ClouDNS Monitoring service!
Round-Trip Time (RTT) is the silent force that shapes our online experiences. From the seamless loading of web pages to the quality of our video calls, RTT plays a pivotal role in ensuring that digital interactions happen at the speed of thought. As we continue to rely on the Internet for work, entertainment, and communication, understanding and optimizing this metric will be crucial for both end-users and network administrators. By reducing it through strategies, we can have a faster, more responsive digital world where our online activities are limited only by our imagination, not by lag.

Hello! My name is Vasilena Markova. I am a Marketing Specialist at ClouDNS. I have a Bachelor’s Degree in Business Economics and am studying for my Master’s Degree in Cybersecurity Management. As a digital marketing enthusiast, I enjoy writing and expressing my interests. I am passionate about sharing knowledge, tips, and tricks to help others build a secure online presence. My absolute favorite thing to do is to travel and explore different cultures!

Related Posts

Ping Traffic Monitoring: Ensuring Network Health and Efficiency
March 28, 2024 • Monitoring
In an era where digital connectivity is the lifeline of businesses and individuals alike, maintaining optimal network performance is more ...
Leave a Reply Cancel reply
Your email address will not be published. Required fields are marked *
Recent Posts
- What is Traffic Director?
- Telnet Explained: What Is It and How It Works?
- Decoding Error 500: Understanding, Preventing, and Resolving the Internal Server Error
- What is a Smurf DDoS attack?
- Linux MTR command
- Cloud Computing
- DNS Records
- Domain names
- Load balancing
- SSL Certificates
- Web forwarding
- DNS Services
- Managed DNS
- Dynamic DNS
- Secondary DNS
- Reverse DNS
- DNS Failover
- Anycast DNS
- Email Forwarding
- Enterprise DNS
- Domain Names
Bunnies are going to Broadcast Asia in Singapore! 🐰 - Let's dive into your future success with bunny.net🚀
Lightning-fast global CDN
A better way to deliver online videos
The world's fastest cloud storage
Powerful image processing & optimization
Next-generation DNS routing
First privacy oriented fonts
- Working on a bigger project? Get in touch with sales
- Video and Streaming
Deliver the best video experience.
Keep your videos secured and safe.
- Storage and Delivery
Best Gaming experience at any scale.
Fastest storage for fastest downloads.
- Website Performance
Supercharge your Website
Permanently store files on the edge.
Say goodbye to slow loading images
#1 Wordpress CDN on the market
- Security and Protection
No more downtimes ever again
DDoS Protection at the Network Edge
- By Industry
Improve your video delivery.
Supercharge your website
Optimize and compress images
Improve your loading speeds
Take control of your security
Deliver best Gaming experience
Supercharge your global downloads
- See how bunny.net helped other companies reach the next leve!. Bunny case studies
Learn more about our goals, values and mission
Help us shape the future of the internet
Keep up to date with our announcements
Easy way to learn how the internet works
The best support In the CDN business
Get in touch with bunny.net team
- Get Started
What is Round Trip Time (RTT)?
What RTT is, the tools that use it, and what it means.
- What is Networking?
Network Basics & Protcols
Performance
Diagnostics
Introduction
The RTT measures latency between a client and host, including the time taken for said host to respond. Tools such as ping , traceroute , and mtr are often used when measuring latency. These tools report various metrics, including latency and the Round Trip Time .
 and how do we measure it")
To understand RTT, you might need a refresher about TCP connections. When a connection is established, a client sends a SYNchronize packet, followed by a SYN-ACK state. If everything goes well, the client receives an ACKnowledge response from the host.
How to measure RTT
Round Trip Time can be measured using any of the tools above, and some others. For this example, let's use ping. When you run ping test.b-cdn.net , you see an output like this:
Take a look at the last line, which refers to the round-trip. The time shown is the total time taken for a request. This includes the time taken for SYNchronization. The next value is the time for the packet (in this case, an ICMP echo) and the time taken for a reply to be ACKnowledged and received.
Diagnostic tests might detect suboptimal latency due to a variety of issues:
- Rate-limiting, wherein routers are configured not to reply after a certain number of ICMP requests.
- Long physical distance can mean your ICMP packet needs to hop over more networks before it reaches its destination.
- Attempting to test network performance to a host on a slow 3G connection; or a heavily congested network
- Servers occasionally experience periods of high congestion, meaning they don't have enough CPU cycles left to send an ACKnowledgement for your ping requests.
For the most part, when measured under typical conditions, RTT can provide valuable insight into the performance of existing routes. With deprioritization, ICMP responses can occasionally be lost or be delayed significantly. In most cases, routers either block or accept requests. Deprioritization is less popular than outright blocking ICMP requests because they make it more difficult to diagnose routing and latency issues.
In essence, RTT is a performance metric returned by ping , traceroute , and many other latency monitors. It is important to understand this metric as it bundles both the time taken to reach the host (using your ISP's routes) and back (using a host's routes). The routes taken to reach a host and back are sometimes different, which is why this metric is so helpful for both end-users and network administrators alike.
Did you find this article helpful?
0 out of 0 Bunnies found this article helpful
A measure of the time between a request being made and fulfilled. Latency is usually measured in milliseconds.
A tool to measure latency on the 3rd layer.
A network diagnostic tool used to find the path taken by a network packet to reach a destination IP.
Round Trip Time is a measure of how long a packet takes to reach a host, and back.
Prove your Knowledge. Earn a bunny diploma.
Test your knowledge in our Junior and Master Quizes to see where you stand. Prove your mastery by getting A+ and recieving a diploma.
What a trip! Measuring network latency in the cloud
Derek phanekham.
PhD student, Computer Science, Southern Methodist University
Software Engineer, Google Cloud Network Performance
A common question for cloud architects is “Just how quickly can we exchange a request and a response between two endpoints?” There are several tools for measuring round-trip network latency, namely ping , iperf , and netperf , but because they’re not all implemented and configured the same, different tools can return different results. And in most cases, we believe netperf returns the more representative answer to the question—you just need to pay attention to the details.
Google has lots of practical experience in latency benchmarking, and in this blog, we’ll share techniques jointly developed by Google and researchers at Southern Methodist University’s AT&T Center for Virtualization to inform your own latency benchmarking before and after migrating workloads to the cloud. We'll also share our recommended commands for consistent, repeatable results running both intra-zone cluster latency and inter-region latency benchmarks.
Which tools and why
All the tools in this area do roughly the same thing: measure the round trip time (RTT) of transactions. Ping does this using ICMP packets, and several tools based on ping such as nping , hping , and TCPing perform the same measurement using TCP packets.
For example, using the following command, ping sends one ICMP packet per second to the specified IP address until it has sent 100 packets.
ping <ip.address> -c 100
Network testing tools such as netperf can perform latency tests plus throughput tests and more. In netperf, the TCP_RR and UDP_RR (RR=request-response) tests report round-trip latency. With the -o flag, you can customize the output metrics to display the exact information you're interested in. Here’s an example of using the test-specific -o flag so netperf outputs several latency statistics:
netperf -H <ip.address> -t TCP_RR -- \ -o min_latency,max_latency,mean_latency
*Note : this uses global options: -H for remote-host and -t for test-name with a test-specific option -o for output-selectors. Example .
As described in a previous blog post , when we run latency tests at Google in a cloud environment, our tool of choice is PerfKit Benchmarker (PKB). This open-source tool allows you to run benchmarks on various cloud providers while automatically setting up and tearing down the virtual infrastructure required for those benchmarks.
Once you set up PerfKit Benchmarker, you can run the simplest ping latency benchmark or a netperf TCP_RR latency benchmark using the following commands:
These commands run intra-zone latency benchmarks between two machines in a single zone in a single region. Intra-zone benchmarks like this are useful for showing very low latencies, in microseconds, between machines that work together closely. We'll get to our favorite options and method to run these commands later in this post.
Latency discrepancies
Let's dig into the details of what happens when PerfKit Benchmarker runs ping and netperf to illustrate what you might experience when you run such tests.
Here, we've set up two c2-standard-16 machines running Ubuntu 18.04 in zone us-east1-c, and we'll use internal ip addresses to get the best results.
If we run a ping test with default settings and set the packet count to 100, we get the following results:
By default, ping sends out one request each second. After 100 packets, the summary reports that we observed an average latency of 0.146 milliseconds, or 146 microseconds.
For comparison, let’s run netperf TCP_RR with default settings for the same amount of packets.
Here, netperf reports an average latency of 66.59 microseconds. The ping average latency reported is ~80 microseconds different than the netperf one; ping reports a value more than twice that of netperf! Which test can we trust?

To explain, this is largely an artifact of the different intervals the two tools used by default. Ping uses an interval of 1 transaction per second while netperf issues the next transaction immediately when the previous transaction is complete.
Fortunately, both of these tools allow you to manually set the interval time between transactions, so you can see what happens when adjusting the interval time to match.
For ping, use the -i flag to set the interval, given in seconds or fractions of a second. On Linux systems, this has a granularity of 1 millisecond, and rounds down. For example, if you use an interval of 0.00299 seconds, this rounds down to 0.002 seconds, or 2 milliseconds. If you request an interval smaller than 1 millisecond, ping rounds down to 0 and sends requests as quickly as possible.
You can start ping with an interval of 10 milliseconds using:
$ ping <ip.address> -c 100 -i 0.010
For netperf TCP_RR, we can enable some options for fine-grained intervals by compiling it with the --enable-spin flag. Then, use the -w flag, which sets the interval time, and the -b flag, which sets the number of transactions sent per interval. This approach allows you to set intervals with much finer granularity, by spinning in a tight loop until the next interval instead of waiting for a timer; this keeps the cpu fully awake. Of course, this precision comes at the cost of much higher CPU utilization as the CPU is spinning while waiting.
*Note : Alternatively, you can set less fine-grained intervals by compiling with the --enable-intervals flag. Use of the -w and -b options requires building netperf with either the --enable-intervals or --enable-spin flag set.
The tests here are performed with the --enable-spin flag set. You can start netperf with an interval of 10 milliseconds using:
$ netperf -H <ip.address> -t TCP_RR -w 10ms -b 1 -- \ -o min_latency,max_latency,mean_latency
Now, after aligning the interval time for both ping and netperf to 10 milliseconds, the effects are apparent:
By setting the interval of each to 10 milliseconds, the tests now report an average latency of 81 microseconds for ping and 94.01 microseconds for netperf, which are much more comparable.

You can illustrate this effect more clearly by running more tests with ping and netperf TCP_RR over a range of varied interval times ranging from 1 microsecond to around ~1 second and plotting the results.

The latency curves from both tools look very similar. For intervals below ~1 millisecond, round-trip latency remains relatively constant around 0.05-0.06 milliseconds. From there, latency steadily increases.
So which tool's latency measurement is more representative—ping or netperf —and when does this latency discrepancy actually matter?
Generally, we recommend using netperf over ping for latency tests. This isn't due to any lower reported latency at default settings, though. As a whole, netperf allows greater flexibility with its options and we prefer using TCP over ICMP. TCP is a more common use case and thus tends to be more representative of real-world applications . That being said, the difference between similarly configured runs with these tools is much less across longer path lengths.
Also, remember that interval time and other tool settings should be recorded and reported when performing latency tests, especially at lower latencies, because these intervals make a material difference.
To run our recommended benchmark tests with consistent, repeatable results, try the following:
For intra-zone cluster latency benchmarking:
This benchmark uses an instance placement policy which is recommended for workloads which benefit from machines with very close proximity to each other.
For inter-region latency benchmarking:
Notice that the netperf TCP_RR benchmarks run with no additional interval setting. This is because by default netperf inserts no added intervals between request/response transactions; this induces more accurate and consistent results.

Note : This latest netperf intra-zone cluster latency result benefits from controlling any added intervals in the test and from using a placement group.
What’s next
In our next network performance benchmarking post, we’ll get into the details about how to use the new public-facing Google Cloud global latency dashboard to better understand the impact of cloud migrations on your workloads.
Also, be sure to check out our PerfKit Benchmarker white paper and the PerfKit Benchmarker tutorials for step-by-step instructions running networking benchmark experiments!
Special thanks to Mike Truty, Technical Curriculum Lead, Google Cloud Learning for his contributions.
- Management Tools
- Google Cloud
- Developers & Practitioners
Related articles

Introducing the Verified Peering Provider program, a simple alternative to Direct Peering
By Dave Schwartz • 7-minute read

Direct VPC egress on Cloud Run is now generally available
By Wietse Venema • 2-minute read

Upgrading Immersive Stream for XR to Unreal Engine 5.3
By Aria Shahingohar • 2-minute read

Announcing the general availability of Next Gen Firewall Enterprise
By Muninder Sambi • 4-minute read
- Documentation
- Screenshots
- Try for Free
The Monitoring Agent
4 types of Agents to help you measure network and application performance.
Network Device Monitoring
Monitor the health of devices like Firewalls, Routers, Switches, Wifi APs and more.
Network Performance Monitoring
Monitor network performance to find and fix issues before they affect users.
Public Monitoring Agents Directory
Proactively Monitor network performance with these service providers.
Understanding & Reducing Network Round-Trip Time (RTT in Networking)
Table of contents.
In the dynamic realm of modern business operations, the heartbeat of connectivity relies on the seamless flow of information across networks. Network administrators and IT professionals, entrusted with the pivotal responsibility of maintaining these vital lifelines, understand the significance of every nanosecond.
In a world where time equates to money and efficiency is non-negotiable, the RTT in networking emerges as a pivotal metric. It represents the time taken for a packet of data to travel from its source to its destination and back again, reflecting the responsiveness and effectiveness of your network infrastructure. As businesses increasingly rely on cloud-based applications, remote collaboration tools, and real-time data analytics, the optimization of RTT has become more critical than ever.
In this comprehensive exploration, we will decode the intricacies of Network Round-Trip Time, demystifying its importance and empowering network administrators and IT professionals with actionable insights to reduce RTT and enhance network performance.
What is Network Round-Trip Time (RTT in Networking)?
First, let’s make sure we’re all on the same page.
Network Round-Trip Time (RTT) in networking, also commonly referred to as Round-Trip Latency or simply Latency, is a crucial metric that measures the time it takes for a packet of data to travel from its source to its destination and back again to the source . RTT is typically expressed in milliseconds (ms) and is a fundamental aspect of network performance.
Here's a breakdown of what RTT encompasses:
- Transmission Time : This is the time it takes for a packet of data to travel from the sender to the receiver. It includes the propagation time (the time it takes for the signal to physically travel through the network medium) and the processing time (the time it takes for routers, switches, and other network devices to handle the packet).
- Propagation Delay : This is the time it takes for an electrical or optical signal to travel over the physical medium, such as a copper or fibre-optic cable. Propagation delay depends on the distance the signal needs to cover and the speed of light or electricity in the medium.
- Queuing and Processing Delay : As data packets pass through routers and switches in a network, they may spend some time in queues waiting for their turn to be processed. This queuing and processing delay can vary based on network congestion and the efficiency of network devices.
In summary, Network Round-Trip Time (RTT) is a key metric in networking that measures the time it takes for data to travel from its source to its destination and back, encompassing transmission time, propagation delay, and queuing/processing delay. It plays a significant role in determining the responsiveness and efficiency of networked applications and services.

The Role of RTT (Network Round-Trip Time) in Network Responsiveness
Network responsiveness, often measured by RTT, is the cornerstone of user satisfaction and efficient operations.
RTT is a critical factor in network performance because it directly impacts the responsiveness of network applications and services. Low RTT values indicate that data can travel quickly between endpoints, resulting in faster response times for applications and a more seamless user experience. On the other hand, high RTT values can lead to delays and sluggish performance.
Reducing RTT is essential in scenarios where real-time communication, online gaming, video conferencing, or the timely delivery of data is crucial. Network administrators and IT professionals often work to optimize RTT by employing various strategies such as using content delivery networks (CDNs), minimizing network congestion, and optimizing routing paths.
- User Expectations : Today's users have high expectations for network responsiveness. Whether it's loading a web page, streaming a video, or making a VoIP call, users demand minimal delays. A low RTT ensures that users experience quick response times, leading to seamless and satisfactory interaction with applications and services.
- Real-Time Applications : Many critical business applications, such as video conferencing, online collaboration tools, and financial trading platforms, require real-time data exchange. RTT directly impacts the effectiveness of these applications. A shorter RTT means that data reaches its destination faster, enabling real-time interactions without noticeable delays.
I. Network Round-Trip Time (RTT) and User Experience
User experience is a key driver of customer satisfaction and loyalty. RTT plays a pivotal role in shaping this experience.
- Website Performance : For businesses with an online presence, website performance is paramount. A website with low RTT loads quickly, ensuring that visitors can access information, make purchases, or engage with content without frustrating delays. Studies have shown that longer page load times due to high RTT can result in higher bounce rates and decreased conversions.
- Video and Media Streaming : In an era of video marketing and content consumption, RTT directly influences the quality of video streaming. Lower RTT values mean faster buffer-free streaming, enhancing the viewer's experience and reducing the likelihood of video interruptions.
II. Network Round-Trip Time’s (RTT) Impact on Business Operations
Beyond user experience, RTT has a profound impact on various aspects of business operations:
- Productivity : In a remote or hybrid work environment, where employees rely on cloud-based applications and data access, RTT can significantly impact productivity. Sluggish network performance due to high RTT values can lead to frustration, downtime, and decreased efficiency.
- Data Transfer : Businesses often need to transfer large volumes of data between locations or to the cloud. High RTT can lead to slow data transfer speeds, potentially affecting data backup, disaster recovery, and the ability to access critical information in a timely manner.
- Customer Service : For businesses that provide customer support or run call centers, low RTT is essential for clear and uninterrupted VoIP calls. High RTT can lead to call dropouts, poor call quality, and dissatisfied customers.
- E-commerce : In the world of e-commerce, where every millisecond counts, RTT can impact sales and customer retention. Slow-loading product pages and checkout processes due to high RTT values can result in abandoned shopping carts and lost revenue.
Understanding the significance of RTT in modern networking is not just a technical matter; it's a fundamental aspect of delivering a positive user experience, maintaining productivity, and ensuring the seamless operation of critical business processes. Network administrators and IT professionals must prioritize RTT optimization to meet the demands of today's digital business landscape.
Ready to Optimize Your Network's Round-Trip Time? Try Obkio Today!
Are you eager to take control of your network's performance and reduce Round-Trip Time (RTT) to boost productivity and enhance user experiences? Look no further than Obkio's Network Performance Monitoring tool, the ultimate solution for network administrators and IT professionals.

Why Choose Obkio:
- Real-Time Monitoring : Obkio provides real-time visibility into your network, allowing you to identify latency bottlenecks and pinpoint performance issues as they happen.
- User-Friendly Interface : With an intuitive and user-friendly interface, Obkio makes it easy to monitor your network's RTT and other critical metrics without the need for complex configurations.
- Actionable Insights : Obkio offers actionable insights and recommendations to help you optimize your network's performance, reduce RTT, and ensure seamless business operations.
- Customized Alerts : Set up custom alerts to be notified of performance deviations, ensuring that you can proactively address issues before they impact your users.
Unlock the Full Potential of Your Network with Obkio. Get Started Today!
Don't let network latency hold your business back. Take the first step towards optimizing your network's Round-Trip Time and providing an exceptional user experience. Try Obkio's Network Performance Monitoring tool now and experience the difference.

Measuring and Calculating Network Round-Trip Time: How to Calculate RTT
While understanding the significance of RTT is vital, the ability to quantify and interpret it accurately is equally crucial for network administrators and IT professionals.
In this section, we’ll equip you with the knowledge and tools necessary to measure, calculate, and make sense of RTT metrics effectively. RTT measurement is not merely a technical exercise; it's a strategic endeavour that empowers you to fine-tune your network for peak performance, deliver an exceptional user experience, and ensure the seamless operation of critical business processes.
So, join us as we explore the RTT formula, discover the range of tools at your disposal for RTT measurement, and learn the art of interpreting RTT metrics.
I. Understanding the Network RTT Formula
The RTT formula is a fundamental concept for anyone aiming to measure and manage network latency effectively. It provides a straightforward way to calculate the Round-Trip Time between two endpoints in a network.
The formula for RTT is as follows:
RTT = (t2 - t1) + (t4 - t3)
- t1 : The time at which the sender sends the packet.
- t2 : The time at which the sender receives an acknowledgment (ACK) from the receiver.
- t3 : The time at which the receiver receives the packet.
- t4 : The time at which the receiver sends the ACK back to the sender.
Understanding this formula allows you to measure RTT manually by recording these timestamps. In practice, however, RTT is often measured automatically using specialized tools and software.
I. Tools for Measuring Network RTT
Accurate RTT measurement is crucial for network administrators and IT professionals. Fortunately, a range of tools and methods are available to simplify this process:
- Network Monitoring Software : Comprehensive network monitoring solutions, such as Obkio's Network Performance Monitoring tool , offer real-time RTT measurement and historical data tracking. These tools provide insights into RTT trends, allowing you to identify performance fluctuations and optimize network resources.
- Ping : The ping command is a simple and widely used tool for measuring RTT. It sends ICMP echo requests to a destination and records the time it takes for responses to return. While ping provides basic RTT information, it may not be suitable for more detailed analysis.
- Traceroute : Traceroute is another command-line tool that helps you trace the path a packet takes to reach its destination. It provides information about each hop along the route, including RTT values. Traceroute is useful for diagnosing latency issues and identifying bottlenecks in the network.
- Packet Analyzers : Packet analyzers like Wireshark capture network packets and provide detailed analysis, including RTT calculations. They are invaluable for diagnosing complex network issues but require a deeper understanding of packet-level data.
- Cloud-Based Monitoring Services : Cloud-based services can measure RTT from multiple locations globally, offering a broader perspective on network performance. These services often include user-friendly dashboards and alerting features.

III. Interpreting Network RTT Metrics
Interpreting RTT metrics is essential for making informed decisions about network optimization. Here's how to understand the data:
- Baseline RTT : Establish a baseline RTT for your network under normal operating conditions. This baseline serves as a reference point for identifying deviations and potential issues.
- Variability : Monitor the variability of RTT values over time. Consistently high or fluctuating RTT can indicate network congestion, equipment problems, or other performance bottlenecks.
- Comparing RTT Metrics : Compare RTT metrics between different endpoints, routes, or network segments. This can help pinpoint specific areas of concern and prioritize optimization efforts.
- Thresholds and Alerts : Set RTT thresholds and network monitoring alerts to be notified when latency exceeds acceptable levels. Proactive alerting allows you to address performance issues before they impact users.
- Root Cause Analysis : When RTT metrics indicate performance problems, use additional tools and diagnostics to perform a root cause analysis. Isolate the source of latency and implement corrective measures.
Interpreting RTT metrics effectively empowers network administrators and IT professionals to make data-driven decisions, optimize network performance, and deliver a seamless user experience.
In conclusion, understanding the RTT formula, utilizing measurement tools, and interpreting RTT metrics are essential steps in managing and improving network latency. These skills enable network professionals to diagnose issues, identify opportunities for optimization, and ensure efficient network performance.
IV. How to Calculate RTT in Networking: An Example
Let's walk through a simple example of calculating Network Round-Trip Time (RTT) for a packet of data travelling between two devices.
Suppose you have a sender ( Device A ) and a receiver ( Device B ) connected to the same network. You want to measure the RTT for a packet of data sent from Device A to Device B and back.
Here are the key timestamps you'll need to measure or record:
- t1 : The time at which Device A sends the packet.
- t2 : The time at which Device A receives an acknowledgment (ACK) from Device B.
- t3 : The time at which Device B receives the packet.
- T4 : The time at which Device B sends the ACK back to Device A.
Now, let's assume the following timestamps:
- t1 : 12:00:00.000 (Device A sends the packet)
- t2 : 12:00:00.150 (Device A receives the ACK from Device B)
- t3 : 12:00:00.200 (Device B receives the packet)
- t4 : 12:00:00.350 (Device B sends the ACK back to Device A)
Now, you can use the RTT formula to calculate the Round-Trip Time:
Plug in the values:
RTT = (12:00:00.150 - 12:00:00.000) + (12:00:00.350 - 12:00:00.200)
RTT = 0.150 seconds + 0.150 seconds
RTT = 0.300 seconds
So, in this example, the calculated Network Round-Trip Time (RTT) for the packet travelling between Device A and Device B is 0.300 seconds, or 300 milliseconds (ms).
This RTT value represents the time it took for the data packet to travel from Device A to Device B and back, including the time it spent in transit and the time it took for the acknowledgment to return.
In this article, we explore the importance of testing network latency for businesses and provide tools and techniques for accurately measuring latency.
How to Measure Network Round-Trip Time with NPM Tools
When it comes to measuring and optimizing Network Round-Trip Time (RTT), Network Performance Monitoring (NPM) tools are your go-to.
NPM tools provide real-time visibility into network performance and continuously and comprehensively monitor various aspects of a network, allowing network administrators to track RTT metrics at multiple points in the network infrastructure.
By offering a granular view of RTT, NPM tools help identify performance bottlenecks, allowing for swift diagnosis and targeted optimization. Additionally, NPM tools often include alerting features that notify administrators when RTT exceeds predefined thresholds, enabling proactive problem resolution before end-users experience the impact.
Moreover, NPM tools are equipped with historical data analysis capabilities, allowing network professionals to identify trends and patterns in RTT values. By identifying long-term RTT patterns, administrators can make informed decisions about capacity planning, infrastructure upgrades, or routing optimization to ensure consistent low-latency network performance.
In a world where network responsiveness is crucial for user satisfaction and business productivity, NPM tools are invaluable for network administrators and IT professionals aiming to maintain optimal RTT and deliver a seamless user experience. Let’s learn how to deploy them!
Step 1. Deploy A Network Performance Monitoring Tool with RTT Monitoring Features
High RTT can lead to delays and sluggish network performance - but how can you know the extent of the problem?
The most accurate way to measure RTT and other key network metrics is by using a Synthetic Network Performance Monitoring Software, like Obkio.
Unlike standalone RTT monitoring tools, Obkio provides a holistic approach to network performance analysis, making it the best choice for measuring RTT and network performance as a whole. With Obkio, gain access to real-time monitoring and reporting features that allow them to measure RTT across their entire network infrastructure, including routers, switches, and end-user devices.
This end-to-end network monitoring tool not only identifies RTT issues but also provides valuable insights into latency, packet loss, bandwidth utilization and more.
Obkio continuously measures network metrics like network RTT by:
- Using Network Monitoring Agents in key network locations
- Simulate network traffic with synthetic traffic and synthetic testing
- Sending packets every 500ms to measure the round trip time it takes for data to travel
- Catch RTT and other network issues affecting key applications and services
Step 2. Measure Round-Trip Time in All Network Locations
Persistent and erratic spikes in Network Round-Trip Time (RTT) measurements are indicative of substantial performance challenges within your network, demanding immediate attention. To pinpoint and resolve these irregularities, implementing RTT monitoring is an indispensable step.
Obkio’s Network Monitoring Solution will measure RRT and other network metrics by sending and monitoring data packets through your network every 500ms using Network Monitoring Agents . The Monitoring Agents are deployed at key network locations like head offices, data centers, and clouds and continuously measure the amount of time it takes for data to travel across your network.
This is extremely important when monitoring RTT and addressing spikes to maintain network efficiency and a smooth user experience, especially in scenarios where real-time data exchange, applications, and services are critical.
For example , you can measure network RTT between your head office and the Microsoft Azure cloud, or even between Azure and your data center.
To deploy monitoring in all your network locations, we recommend deploying:
- Local Agents : Installed in the targeted office location experiencing performance issues or latency spikes. There are several Agent types available (all with the same features), and they can be installed on MacOS, Windows, Linux and more.
- Public Monitoring Agent : These are deployed over the Internet and managed by Obkio. They compare performance up to the Internet and quickly identify if the performance issue is global or specific to the destination. For example, measure RTT between your branch office and Google Cloud .

Step 3. Measure Round-Trip Time for Network Devices
Network Device Monitoring is also crucial for accurately measuring and managing Network Round-Trip Time (RTT). Network devices, such as routers, switches, and firewalls, play a significant role in determining the latency and RTT experienced by data packets as they traverse the network.
Obkio’s Network Device Monitoring feature is a fast and easy solution to get detailed information about the health of your core network devices. Used with the end-to-end Network Performance Monitoring feature, Network Device Monitoring with SNMP Polling helps IT teams quickly and proactively pinpoint issues with devices like firewalls, routers, switches and Wi-Fi access points.
Network devices are key points of control and routing within a network. Monitoring these devices allows you to gain insights into their performance, such as how efficiently they process and forward data packets. Device monitoring helps identify issues like high CPU utilization, memory constraints, or network interface errors, which can all contribute to increased RTT.
Here are the key network devices you should consider monitoring when measuring network round-trip time:
- Routers : Routers are pivotal devices in network traffic management. They determine the path data packets take between networks and subnetworks. Monitoring routers helps identify congestion points, routing issues, and overall device performance.
- Switches : Network switches are responsible for forwarding data packets within a local network (LAN). Monitoring switches helps ensure that LAN traffic is efficiently handled and doesn't introduce unnecessary RTT.
- Firewalls : Firewalls are essential for network security but can also introduce latency. Monitoring firewalls helps verify that they're processing data packets efficiently and not creating undue RTT delays.
- Load Balancers : Load balancers distribute network traffic across multiple servers or resources to ensure load distribution and fault tolerance. Monitoring load balancers helps maintain even traffic distribution and low RTT.
- Gateways : Gateways connect different networks, such as LANs to the internet. Monitoring gateways is essential for ensuring data packets are efficiently routed between internal networks and external destinations.
- WAN Optimization Devices : These devices are commonly used in wide-area networks (WANs) to reduce latency and optimize data transfer. Monitoring WAN optimization devices ensures they're operating as intended to minimize RTT.
- Access Points (APs) : In wireless networks, APs play a critical role in data transmission. Monitoring APs helps maintain consistent wireless network performance, minimizing RTT for mobile or remote users.
- DNS Servers : DNS (Domain Name System) servers translate domain names into IP addresses. Monitoring DNS servers ensures that DNS resolution doesn't introduce delays when clients access network resources.
- Network Endpoints : Monitoring the performance of endpoints (e.g., servers, workstations, and user devices) is vital for understanding how network devices affect RTT from the user's perspective.
- Virtualization and SDN Controllers : In virtualized or software-defined networks, controllers manage network resources and routing. Monitoring these controllers helps ensure efficient data flow and low RTT.
To comprehensively measure and optimize RTT, it's essential to monitor a variety of network devices . The choice of devices to monitor may depend on the specific characteristics of your network and the critical points for your organization.

Step 4. Collect Network Round-Trip Time Measurements
Once you’ve set up your Monitoring Agents for network latency monitoring , they continuously measure metrics like RTT measure and collect data, which you can easily view and analyze on Obkio’s Network Response Time Graph.
Measure RTT throughout your network with updates every minute. This will help you understand and measure good round-trip time measurements for different applications vs. poor latency. If your RTT levels go from good to poor, you can also further drill down to identify exactly why RTT issues are happening, where they’re happening, and how many network locations they’re affecting.
To more accurately measure RTT in your network, and receive alerts when latency measurements are poor, Obkio sends alerts based on historical data and not just static thresholds.
As soon as there’s a deviation in the historical data, and your network is experiencing poor RTT measurements, Obkio sends you an alert.
It’s as simple as that
Step 5. Monitor More Network Metrics Alongside Network Round-Trip Time
Once deployed, Obkio’s Monitoring Agents will begin exchanging synthetic traffic to continuously measure network performance and core network metrics .
When monitoring network performance and assessing the health of your network, it's important to measure a range of network metrics alongside Network Round-Trip Time (RTT) to gain a comprehensive understanding of the network's behaviour and potential issues. Here are several key network metrics to consider:
- Packet Loss : Packet loss indicates the percentage of data packets that fail to reach their destination. High packet loss can significantly impact the quality of network services and applications.
- Jitter : Jitter is the variation in latency or RTT. Consistent RTT values are desirable, but high jitter can lead to unpredictable network performance, which is problematic for real-time applications like VoIP and video conferencing.
- Bandwidth Utilization : Monitoring bandwidth usage helps you identify periods of congestion and overutilization, which can lead to increased RTT. By monitoring bandwidth, you can proactively manage network capacity.
- Throughput : Throughput measures the rate at which data is transmitted over the network. It's essential for assessing the actual data transfer capacity of your network, especially for large file transfers or media streaming.
- Error Rate : The network error rate indicates the number of data packets with errors or corruption. High error rates can lead to retransmissions, increasing latency and packet loss.
- QoS Metrics : Quality of Service (QoS) metrics include parameters like latency, jitter, and packet loss, specific to certain traffic types. Monitoring QoS compliance is essential for prioritizing critical applications and ensuring they meet performance requirements.
- Device Performance : Monitoring the performance of network devices such as routers, switches, and firewalls is crucial. High CPU usage , memory issues, or hardware problems can impact network performance and increase RTT.
- Availability and Uptime : Monitoring network availability and network uptime is essential for identifying periods of network unavailability or downtime, which can impact services and applications.
By measuring these network metrics alongside RTT, you can gain a holistic view of your network's performance, detect issues promptly, and proactively optimize network resources to provide a seamless user experience and support critical business operations.

Understanding Good vs. Bad Network Round-Trip Time Measurements
In the intricate world of networking, the metric known as Network Round-Trip Time (RTT) serves as a crucial barometer of performance. However, RTT is not a one-size-fits-all metric, and its evaluation must be tailored to the specific needs and demands of a network or application.
In this section, we delve into the nuanced realm of RTT measurements, deciphering what constitutes good and bad readings, and how these metrics reverberate through the fabric of network performance.
Good and bad RTT measurements are relative and depend on the specific context and requirements of a network or application. What is considered good or bad RTT can vary based on factors such as the type of network, the application's sensitivity to latency, and the expectations of users. However, here are some general guidelines to consider:
I. Good Network RTT Measurements
- Low and Consistent : Good RTT measurements typically exhibit low and consistent values. Low RTT indicates that data is transmitted quickly, providing a responsive user experience. Consistency ensures that users can rely on predictable network performance.
- Match Application Requirements : Good RTT measurements should meet or exceed the requirements of the applications and services being used. For example, real-time applications like video conferencing or online gaming often require RTT values below 100 milliseconds to provide a seamless experience.
- Minimal Jitter : Good RTT measurements have minimal jitter, meaning that there is little variation in RTT values. Jitter can disrupt real-time applications, so a stable and low-latency network is desired.
II. Bad Network RTT Measurements:
- High and Fluctuating : Bad RTT measurements typically exhibit high values and significant fluctuations. High RTT values can lead to sluggish network performance and application responsiveness, while fluctuations introduce unpredictability.
- Exceed Application Tolerances : For some applications, any RTT values beyond specific thresholds can be considered bad. For example, an online multiplayer game might become unplayable with RTT exceeding 200 milliseconds.
- Frequent Packet Loss : Consistent packet loss and retransmissions can lead to bad RTT measurements. Packet loss is a sign of network congestion or instability, and it can severely impact network performance.
- Long-Term Performance Issues : Consistently bad RTT measurements over an extended period, even if they are not extremely high, may indicate underlying network issues that need to be addressed. It's essential to identify and resolve long-term performance problems to maintain a reliable network.
In summary, good RTT measurements are characterized by low, consistent values that meet the requirements of the network's applications, with minimal jitter. Bad RTT measurements, on the other hand, involve high, fluctuating values, packet loss, and latency that exceeds application tolerances. To assess RTT measurements, it's important to consider the specific network requirements and the impact of latency on user experience in your particular environment.

Identifying, Troubleshooting, and Common Network Round-Trip Time (RTT) Issues
In the world of networking, Network Round-Trip Time (RTT) serves as a vital performance indicator. When RTT issues arise, they can lead to sluggish network responsiveness and user dissatisfaction. This section is your guide to identifying and troubleshooting common RTT problems that can affect network performance.
We'll dive into the practical aspects of recognizing RTT issues, whether through real-time monitoring or user feedback. We'll also explore the common culprits behind elevated RTT, such as congestion and configuration problems.
I. Identifying Network RTT Issues
- Real-time Monitoring : Regularly monitor RTT using network performance monitoring tools, like Obkio NPM . These tools provide real-time data on RTT, enabling you to detect anomalies or spikes that might indicate issues.
- Baseline Measurement : Establish a baseline for expected RTT values in your network. Deviations from this baseline can be an early indicator of RTT problems.
- User Feedback : Listen to user complaints or feedback. Slow application response times or connectivity issues reported by users can be indicative of RTT issues.
- Historical Analysis : Analyze historical RTT data to identify patterns or trends. Consistent RTT issues at specific times or on particular network segments can point to the source of the problem.
- Network Topology Review : Examine your network topology to identify potential bottlenecks or congestion points that may contribute to high RTT.
II. Uncovering The Most Common Network RTT Issues
- Network Congestion : Heavy network traffic can lead to network congestion , queuing delays, and packet loss, resulting in increased RTT. Implement Quality of Service (QoS) to prioritize essential traffic and reduce congestion.
- Long Geographic Distance : Data travelling over long distances, especially in wide-area networks (WANs), can experience high propagation delay, contributing to elevated RTT. Consider implementing content delivery networks (CDNs) to reduce the impact of distance.
- Hardware and Configuration Problems : Outdated or misconfigured network devices, such as routers and switches, can lead to performance issues and high RTT. Regularly review and update hardware and configurations to address these problems.
- Packet Loss : Packet loss , where data packets are dropped or need to be retransmitted, can increase RTT. Troubleshoot packet loss issues by identifying and rectifying network faults or congestion points.
- Jitter : Inconsistent RTT values and jitter can affect real-time applications. Jitter is often a result of network congestion or configuration problems, so minimizing these issues helps reduce jitter and improve RTT.
III. Troubleshooting Network RTT Issues:
So what happens when your NPM tool starts alerting you about sudden spikes in round-trip time? Well, it’s time to troubleshoot! First, you need to understand why the network issue is happening, where and when.
- Isolate the Problem : Start by identifying the affected network segment or path with high RTT. Network monitoring tools can help pinpoint the problematic area.
- Traffic Analysis : Analyze the network traffic on the identified segment to determine if congestion or unusual patterns are causing high RTT.
- Device Inspection : Examine the performance of network devices along the path, such as routers and switches. High CPU usage or configuration errors may be contributing to RTT issues.
- Quality of Service (QoS) Adjustment : If network congestion is the root cause, consider implementing or adjusting QoS policies to prioritize critical traffic and reduce congestion.
- Optimization Techniques : Implement optimization techniques such as route optimization, network load balancing , and the use of CDNs to improve network efficiency and reduce RTT.
- Testing and Validation : After making adjustments, conduct tests to validate that RTT has improved. Monitor the network to ensure that RTT remains within acceptable ranges.
- Regular Maintenance : Ongoing network maintenance, including updates, hardware upgrades, and configuration reviews, is essential for preventing future RTT issues.
By systematically identifying, troubleshooting, and addressing RTT issues, network administrators can maintain low-latency networks, ensure a seamless user experience, and minimize the impact of common RTT problems.
Learn how to troubleshoot network issues by identifying where, what, why network problems occur with Network Troubleshooting tools.
Factors Affecting Network Round-Trip Time (RTT)
As we navigate the realm of Network Round-Trip Time (RTT) and its role in network optimization, we encounter an array of influential factors that shape the journey of data from source to destination and back. In this chapter, we embark on a comprehensive exploration of these key factors, each wielding the power to either elevate or hinder network performance.
Understanding the factors affecting RTT is paramount for network administrators and IT professionals, as it equips them with the knowledge needed to fine-tune their networks for maximum efficiency and responsiveness.
1. Network Congestion on RTT in Networking
Network congestion occurs when there is a higher volume of traffic on a network than it can efficiently handle. This congestion can significantly impact RTT:
- Increased Latency : Congestion leads to packet queuing, where data packets must wait in line to be processed by network devices. The increased latency due to this queuing results in higher RTT values, causing delays in data transmission.
- Packet Loss : In congested networks, packets may be dropped to relieve congestion. This packet loss not only contributes to higher RTT as packets are retransmitted but also affects the reliability and performance of network applications.
- Quality of Service (QoS) : Implementing Quality of Service policies can help mitigate congestion by prioritizing certain types of traffic. This can help ensure that critical applications experience lower RTT values even during network congestion.
2. Geographic Distance on RTT in Networking
Geographic distance plays a fundamental role in determining RTT, especially in wide-area networks and global connectivity:
- Propagation Delay : As data travels over long distances, it experiences propagation delay. This delay is the time it takes for signals to traverse the physical medium (e.g., fibre-optic cables or satellite links) between network endpoints. The greater the distance, the higher the propagation delay, contributing to increased RTT.
- WAN vs. LAN : Wide Area Networks ( WANs ) typically involve greater geographic distances than Local Area Networks ( LANs ). WANs often exhibit higher RTT values due to the inherent challenges of data transmission across extensive physical distances.
- Use of Content Delivery Networks (CDNs) : CDNs can help mitigate the impact of geographic distance by caching and delivering content from servers closer to end-users. This minimizes the effects of long-distance transmission on RTT.
3. Network Hardware and Configurations on RTT in Networking
The hardware and configuration of network devices and infrastructure can significantly affect RTT:
- Router and Switch Performance : The processing capacity of routers and switches in the network can impact the speed at which packets are forwarded. Outdated or underpowered devices can introduce additional latency and increase RTT.
- Network Path Efficiency : The chosen network paths and routing algorithms also play a role. Inefficient routing can lead to longer paths and, subsequently, higher RTT.
- Configuration Errors : Misconfigurations in network devices, such as incorrect routing tables or Quality of Service settings, can lead to suboptimal performance and increased RTT. Regular network audits and optimization are essential to address configuration issues.
4. Packet Loss and Jitter on RTT in Networking
Packet loss and jitter are network phenomena that can cause variations in RTT:
- Packet Loss : Packet loss occurs when data packets fail to reach their intended destination. Repeated packet loss results in retransmissions, which contribute to increased RTT. Reducing and measuring packet loss through network optimization is essential for minimizing RTT.
- Jitter : Jitter refers to the variation in packet arrival times. Excessive jitter can cause fluctuations in RTT, affecting the predictability of network performance. QoS mechanisms and traffic shaping can help mitigate jitter-related RTT issues.
Understanding these factors and their impact on RTT is crucial for network administrators and IT professionals. By addressing these challenges through proactive network management, optimization, and the use of appropriate technologies, it's possible to achieve lower RTT and maintain efficient and responsive network performance.

Network Round-Trip Time (RTT) vs. Latency: Comparing Network Siblings
In the world of networking and data transmission, terms like "Network Round-Trip Time (RTT)" and "latency" often take center stage, reflecting the critical aspect of speed and responsiveness in today's digital landscape. While these terms are sometimes used interchangeably, they represent distinct facets of network performance.
In this section, we’ll unravel the differences between Network Round-Trip Time (RTT) and latency. Understanding these concepts is fundamental for network administrators and IT professionals as it enables them to grasp the nuances of network performance and address specific challenges effectively.
I. Defining Latency
Latency is a general term that refers to any delay or lag in data transmission within a network . It encompasses all delays encountered during data communication, including the time it takes for data to travel between two points (which is what RTT specifically measures), as well as other types of delays such as processing delays, queuing delays, and transmission delays.
Latency can be categorized into several types:
- Propagation Delay : The time it takes for a signal or data packet to physically travel over the network medium (e.g., copper cables, fibre-optic cables, or wireless links). It is directly related to the distance between two network points and the speed of the medium.
- Transmission Delay : The time it takes to push the entire data packet into the network medium. It is influenced by the packet's size and the speed of the network link.
- Processing Delay : The time it takes for network devices like routers and switches to process and forward data packets. This can be affected by the performance of these devices and their configurations.
- Queuing Delay : The time data packets spend in queues at various points in the network, waiting for their turn to be processed. High congestion or network traffic can increase queuing delays.
- Jitter : Jitter refers to variations in latency. Inconsistent latency can affect the predictability of network performance, which is particularly critical for real-time applications.
II. Defining Network Round-Trip Time (RTT)
As we've already discussed in this article, RTT is a specific metric used to measure the time it takes for a data packet to travel from its source to its destination and back to the source . It is a subset of latency that focuses on the round-trip journey of a packet. RTT is measured in milliseconds (ms) and is often used to evaluate network responsiveness.
The RTT calculation typically involves the following timestamps:
- The time the sender sends the packet.
- The time the sender receives an acknowledgment (ACK) from the receiver.
- The time the receiver receives the packet.
- The time the receiver sends the ACK back to the sender.
By subtracting the appropriate timestamps, you can calculate the RTT for a specific packet.
In summary, latency is a broader term that encompasses various types of delays in data transmission, including RTT. RTT specifically measures the round-trip time for a packet, which is crucial for understanding the responsiveness of a network, particularly in applications that require timely data exchange, such as video conferencing or online gaming.
We asked a supercomputer “What is latency”, its impact on network performance, and strategies for minimizing it and created this comprehensive guide.
The Quest for Lower Network Round-Trip Time: How to Reduce Network RTT
In the quest for network optimization and superior user experiences, one metric stands as a sentinel of responsiveness - Network Round-Trip Time (RTT). A lower RTT signifies not only the swift transmission of data but also the realization of network efficiency, seamless applications, and satisfied users.
Here, we will explore the art of reducing RTT through a variety of carefully crafted strategies. From optimizing network topology to the art of content caching and compression, from harnessing the power of load balancing to the efficiency of Content Delivery Networks (CDNs), we will venture into the multifaceted realm of RTT reduction.
I. Strategies for Reducing Network RTT
Reducing RTT is a fundamental objective in optimizing network performance . So, there are several strategies to help you achieve this:
- Optimizing Network Topology : A well-designed network topology that minimizes the number of network hops and ensures efficient routing can significantly reduce RTT. Strategies like hierarchical network design and route optimization contribute to lower latency.
- Quality of Service (QoS) Implementation : Prioritizing real-time traffic and critical applications through QoS policies can reduce contention for network resources and lower RTT for those essential services.
- Edge Computing : Deploying computing resources closer to end-users or IoT devices at the network edge can reduce RTT by decreasing the physical distance that data needs to travel.
- TCP/IP Optimization : Fine-tuning TCP/IP parameters and employing technologies like TCP window scaling and selective acknowledgments can improve data transfer efficiency and lower RTT.
II. Load Balancing and Redundancy for Reducing Network RTT
Load balancing and redundancy are vital components in RTT reduction:
- Load Balancing : Distributing network traffic across multiple servers or paths ensures that no single server or network link becomes overwhelmed. This strategy not only increases network capacity but also reduces the likelihood of network congestion and high RTT.
- Redundancy : Implementing redundancy through network failover mechanisms or backup links can mitigate the impact of network failures. Redundancy ensures that if one path experiences issues, traffic can be rerouted quickly, minimizing RTT.
III. Content Delivery Networks (CDNs) for Reducing Network RTT
CDNs are instrumental in RTT reduction, particularly for web content delivery:
- Caching : CDNs cache content on servers located in geographically distributed edge locations. This means users can access content from a nearby server, reducing the need to retrieve data from the origin server, and consequently lowering RTT.
- Content Prioritization : CDNs allow prioritizing and delivering the most critical content quickly, which is especially beneficial for reducing RTT for web pages, images, and videos.
IV. Caching and Compression for Reducing Network RTT
Caching and compression techniques are powerful tools for minimizing RTT:
- Data Caching : Caching frequently accessed data locally, either at the client side or at intermediate network nodes, allows for quicker retrieval of data, reducing RTT.
- Data Compression : Compressing data before transmission and decompressing it at the receiver's end decreases the amount of data to be transferred, ultimately lowering RTT.
By implementing these strategies and technologies, network administrators and IT professionals can actively work to reduce RTT, enhance network performance, and deliver a more responsive user experience. Each strategy offers a unique approach to address latency and can be adapted to the specific needs and goals of the network environment.
Tools and Technologies for Optimizing Network Round-Trip Time: Network RTT Optimization
In the realm of network performance, the pursuit of lower Network Round-Trip Time (RTT) is both an art and a science. It requires the judicious selection and deployment of tools and technologies that act as enablers, elevating networks to realms of enhanced responsiveness and efficiency.
Here, we uncover the spectrum of tools at your disposal, explore their capabilities, and provide insights into the selection process to ensure you choose the right tools that align with your unique business needs. Earlier in this article, we already talked about measuring RTT and identifying RTT issues with Network Performance Monitoring tools - which are also a key tool for optimizing round-trip time.
With the right tools in your arsenal, you can orchestrate a network that not only understands the melody of RTT but dances to its tune, delivering a harmonious and responsive user experience.
I. Network Monitoring and Analytics Solutions for Optimizing Network RTT
Monitoring and analytics tools are instrumental in the quest for RTT optimization:
- Network Performance Monitoring (NPM) : NPM solutions continuously monitor network performance, providing real-time visibility into RTT metrics. They enable network administrators to detect and diagnose issues promptly, making them a vital tool for maintaining low RTT.
- Packet Capture and Analysis Tools : Packet capture tools allow the in-depth analysis of network traffic. Administrators can use these tools to capture and examine packets, enabling them to identify bottlenecks and other issues contributing to RTT delays.
- Network Traffic Analysis : Advanced network traffic analysis solutions provide insights into application behaviour, network usage , and patterns. These tools help optimize network paths and configurations to lower RTT.
II. SD-WAN and Network Optimization Platforms for Optimizing Network RTT
SD-WAN (Software-Defined Wide Area Network) and network optimization platforms offer dynamic solutions for RTT optimization:
- SD-WAN : SD-WAN technology leverages multiple network connections and dynamically routes traffic over the most efficient path. It includes features such as traffic prioritization and application-aware routing, which are beneficial for optimizing RTT for critical applications. The same goes for Dual-WAN networks .
- WAN Optimization Controllers : These devices optimize data traffic between WAN endpoints by employing techniques like data deduplication, compression, and caching. WAN optimization reduces the amount of data transferred, reducing RTT.
- Content Delivery Platforms : Content delivery platforms, combined with CDNs, accelerate the delivery of web content by distributing it to edge servers. This minimizes the physical distance data needs to travel, resulting in reduced RTT for web-based services.
III. Choosing the Right Tools for Optimizing RTT in Your Business
Selecting the right tools for RTT optimization requires careful consideration:
- Assessing Business Needs : Start by identifying the specific requirements of your business. Consider factors like the nature of your applications, your network topology, and your performance goals. This assessment guides the choice of tools and technologies.
- Scalability : Ensure that the selected tools and technologies can scale with your business as it grows. Scalable solutions can adapt to increased network demands without compromising RTT.
- Compatibility : The tools and technologies you choose should seamlessly integrate with your existing network infrastructure. Compatibility ensures smooth implementation and operation.
- Budget Considerations : Evaluate the cost of implementation and ongoing maintenance. Balancing your budget with the need for high-performance tools is vital to achieving cost-effective RTT optimization.
- Monitoring and Maintenance : Plan for continuous monitoring and maintenance of the chosen tools and technologies. Regular updates and adjustments are necessary to adapt to evolving network conditions and maintain low RTT.
By exploring the array of tools and technologies available for RTT optimization and making informed choices that align with your specific network requirements, you can ensure that your network operates at its peak performance, delivering low RTT and a seamless user experience.

Harnessing the Power of Round-Trip Time (Network RTT) Optimization for Business Success
In the fast-paced digital landscape, where every millisecond counts, optimizing Network Round-Trip Time (RTT) should be a top priority for network admins. Achieving low and consistent RTT not only enhances the user experience but also impacts business operations in numerous ways.
For businesses, RTT optimization means improved productivity, reduced downtime, and the ability to leverage real-time applications to their full potential. In e-commerce, it can translate to higher sales, as low latency ensures swift page loads and seamless transactions. For video conferencing and collaboration tools, it means clearer communication and increased efficiency. In the realm of online gaming, it can be the difference between a competitive edge and a frustrating experience for gamers.
By harnessing the power of RTT optimization, businesses ensure that their digital offerings meet the high expectations of today's users and remain competitive in an ever-evolving market.
Measuring and Optimizing Network RTT with Obkio’s NPM Tool
To start measuring and optimizing RTT, you need the right tools, and Obkio's Network Performance Monitoring (NPM) tool stands as a valuable ally.
With Obkio, you can measure, monitor, and optimize RTT with precision. Get real-time insights into network performance, offering visibility into RTT metrics at various network points. Obkio equips network admins and IT professionals with the means to detect and resolve RTT issues promptly, ensuring that network operations remain seamless and efficient. With Obkio, you can proactively manage RTT, detect anomalies, and maintain low-latency network performance.
As you harness the power of Obkio's NPM tool, you're well-equipped to elevate your network to new heights of efficiency, ultimately contributing to the success of your business in a digitally connected world!
- 14-day free trial of all premium features
- Deploy in just 10 minutes
- Monitor performance in all key network locations
- Measure real-time network metrics
- Identify and troubleshoot live network problems
You can rest assured that we're not like those pushy Sellsy people - there's no catch here. We firmly believe in the excellence of our product, but if it's not the right fit for you, we understand and want what's best for you.
These might interest you
19 network metrics: how to measure network performance, how to measure latency, say goodbye to network headaches..
Get a live demo of Obkio now!
Did you know?

Round Trip Time (RTT) Delay in the Internet: Analysis and Trends
Ieee account.
- Change Username/Password
- Update Address
Purchase Details
- Payment Options
- Order History
- View Purchased Documents
Profile Information
- Communications Preferences
- Profession and Education
- Technical Interests
- US & Canada: +1 800 678 4333
- Worldwide: +1 732 981 0060
- Contact & Support
- About IEEE Xplore
- Accessibility
- Terms of Use
- Nondiscrimination Policy
- Privacy & Opting Out of Cookies
A not-for-profit organization, IEEE is the world's largest technical professional organization dedicated to advancing technology for the benefit of humanity. © Copyright 2024 IEEE - All rights reserved. Use of this web site signifies your agreement to the terms and conditions.
- Skip to main content
- Skip to search
- Skip to select language
- Sign up for free
Round Trip Time (RTT)
Round Trip Time (RTT) is the length time it takes for a data packet to be sent to a destination plus the time it takes for an acknowledgment of that packet to be received back at the origin. The RTT between a network and server can be determined by using the ping command.
This will output something like:
In the above example, the average round trip time is shown on the final line as 26.8ms.
- Time to First Byte (TTFB)
- Engineering Mathematics
- Discrete Mathematics
- Operating System
- Computer Networks
- Digital Logic and Design
- C Programming
- Data Structures
- Theory of Computation
- Compiler Design
- Computer Org and Architecture
What is RTT(Round Trip Time)?
- What is Real-Time Linux?
- What is RTS(Real Time Streaming)?
- What is Time-To-Live (TTL)?
- Program to calculate the Round Trip Time (RTT)
- What is TCP Fast Open?
- Difference between Round trip time (RTT) and Time to live (TTL)
- Real Time Transport Protocol (RTP)
- How to subtract time in R ?
- Python time.tzset() Function
- TCP Tahoe and TCP Reno
- Ruby | Time to_time function
- Ruby | Time round function
- What is 15:00 Military Time?
- Time tuple in Python
- What Time will it be in 24 Hours From Now?
- Dart - Date and Time
- Ruby | Time utc function
- time.Time.Round() Function in Golang with Examples
- Ruby | Time to_r function
- What is OSI Model? - Layers of OSI Model
- TCP/IP Model
- Basics of Computer Networking
- Types of Network Topology
- Network Devices (Hub, Repeater, Bridge, Switch, Router, Gateways and Brouter)
- RSA Algorithm in Cryptography
- Caesar Cipher in Cryptography
- Differences between TCP and UDP
- TCP Server-Client implementation in C
- Types of Transmission Media
RTT (Round Trip Time) also called round-trip delay is a crucial tool in determining the health of a network. It is the time between a request for data and the display of that data. It is the duration measured in milliseconds.
RTT can be analyzed and determined by pinging a certain address. It refers to the time taken by a network request to reach a destination and to revert back to the original source. In this scenario, the source is the computer and the destination is a system that captures the arriving signal and reverts it back.

RTT(Round Trip Time) Measurement
What Are Common Factors that Affect RTT?
There are certain factors that can bring huge changes in the value of RTT. These are enlisted below:
- Distance: It is the length in which a signal travels for a request to reach the server and for a response to reach the browser,
- Transmission medium: The medium which is used to route a signal, which helps in faster transfer of request is transmitted.
- Network hops: It is the time that servers take to process a signal, on increasing the number of hops, RTT will also increase.
- Traffic levels: Round Trip Time generally increases when a network is having huge traffic which results in that, for low traffic RTT will also be less.
- Server response time: It is the time taken by a server to respond to a request which basically depends on the capacity of handling requests and also sometimes on the nature of the request.
Applications of RTT
Round Trip Time refers to a wide variety of transmissions such as wireless Internet transmissions and satellite transmissions. In Internet transmissions, RTT may be identified by using the ping command. In satellite transmissions, RTT can be calculated by making use of the Jacobson/Karels algorithm.
Advantages of RTT
Calculation of RTT is advantageous because:
- It allows users and operators to identify how long a signal will take to complete the transmission.
- It also determines how fast a network can work and the reliability of the network.
Example: Let us assume there are two users, one of which wants to contact the other one. One of them is located in California while the other one is situated in Germany. When the one in California makes the request, the network traffic is transferred across many routers before reaching the server located in Germany. Once the request reverts back to California, a rough estimation of the time taken for this transmission could be made. This time taken by the transmitted request is referred to as RTT. The Round Trip Time is a mere estimate. The path between the two locations can change as the passage and network congestion can come into play, affecting the total period of transmission.
How Does Round-Trip Time Work?
Consider a topology where an appliance named “Exinda” is located between the client and the server. The diagram shown below depicts how the concept of RTT works:

RTT Calculation
For the calculation of Average RTT, RTTS for server and client needs to be calculated separately. The performed calculations are shown below:
Server RTT: RTT1 = T2 – T1 RTT2 = T5 – T4
Client RTT: RTT3 = T3 – T2 RTT4 = T7 – T6
Average RTT: Avg Server RTT = (RTTs1 + RTTs2) / 2 Avg Client RTT = (RTTc1 + RTTc2) / 2 Avg Total RTT = Avg Server RTT + Avg Client RTT
You can refer to the Program to calculate RTT for more details.
Measures To Reduce RTT
A significant reduction in RTT can be made using Content Delivery Network (CDN) . A CDN refers to a network of various servers, each acquiring a copy of the content on a particular website. It addresses the factors affecting RTT in the enlisted ways:
- Points of Presence (PoP)
- Web caching
- Load distribution
- Scalability
- Tier 1 access
CDN has been largely successful in reducing the value of RTT and due to this, a decrease in RTT by 50% is achievable.
Please Login to comment...
Similar reads.

Improve your Coding Skills with Practice
What kind of Experience do you want to share?
This browser is no longer supported.
Upgrade to Microsoft Edge to take advantage of the latest features, security updates, and technical support.
Azure network round-trip latency statistics
- 8 contributors
Azure continuously monitors the latency (speed) of core areas of its network using internal monitoring tools and measurements.
How are the measurements collected?
The latency measurements are collected from Azure cloud regions worldwide, and continuously measured in 1-minute intervals by network probes. The monthly latency statistics are derived from averaging the collected samples for the month.
Round-trip latency figures
The monthly Percentile P50 round trip times between Azure regions for a 30-day window are shown in the following tabs. The latency is measured in milliseconds (ms).
The current dataset was taken on April 9th, 2024 , and it covers the 30-day period ending on April 9th, 2024 .
For readability, each table is split into tabs for groups of Azure regions. The tabs are organized by regions, and then by source region in the first column of each table. For example, the East US tab also shows the latency from all source regions to the two East US regions: East US and East US 2 .
Monthly latency numbers across Azure regions do not change on a regular basis. You can expect an update of these tables every 6 to 9 months. Not all public Azure regions are listed in the following tables. When new regions come online, we will update this document as soon as latency data is available.
You can perform VM-to-VM latency between regions using test Virtual Machines in your Azure subscription.
- North America / South America
- Australia / Asia / Pacific
- Middle East / Africa
Latency tables for Americas regions including US, Canada, and Brazil.
Use the following tabs to view latency statistics for each region.
Latency tables for European regions.
Latency tables for Australia, Asia, and Pacific regions including and Australia, Japan, Korea, and India.
Latency tables for Middle East / Africa regions including UAE, South Africa, Israel, and Qatar.
- Canada / Brazil
- Western Europe
- Central Europe
- Norway / Sweden
- UK / North Europe
- UAE / Qatar / Israel
- South Africa
Round-trip latency to West India from other Azure regions is included in the table. However, West India is not a source region so roundtrips from West India are not included in the table.]
Additionally, you can view all of the data in a single table.

Learn about Azure regions .
Coming soon: Throughout 2024 we will be phasing out GitHub Issues as the feedback mechanism for content and replacing it with a new feedback system. For more information see: https://aka.ms/ContentUserFeedback .
Submit and view feedback for
Additional resources
- Looking Glass
- Developer Tools
- Status Page
- Case studies
- Press & Media
- Product Roadmap
- Product Documentation
- API Documentation
- Help Center
- CDN for Gaming
- Game Server Protection
- Game Development
- CDN for Video
- Video Hosting
- Live Streaming
- Video Calls
- Metaverse Streaming
- TV & Online Broadcasters
- Sport Broadcasting
- Online events
- Cloud for financial services
- Image Optimization
- Website Acceleration
- WordPress CDN
- White Label Program
- CDN for E-commerce
- AI Universities
- Online Education
- Wordpress CDN
- DDoS Protection
- Penetration Test
- Web Service
- White Label Products
- Referral Program
- Data Migration
- Disaster Recovery
- Content Hub Content Hub Blog Learning News Case studies Downloads Press & Media API Documentation Product Roadmap Product Documentation Help Center
- Tools Tools Looking Glass Speed Test Developer Tools Status Page
- Talk to an expert
- Under attack?
Select the Gcore Platform
- Edge Delivery (CDN)
- DNS with failover
- Virtual Machines
- Cloud Load Balancers
- Managed Kubernetes
- AI Infrastructure
- Edge Security (DDOS+WAF)
- Object Storage
- ImageStack (Optimize and Resize)
- Edge Compute (Coming soon)
- VPS Hosting
- Dedicated Servers
What is round-trip time (RTT) and how to reduce it?
In this article, factors affecting rtt, how to calculate rtt using ping, normal rtt values, how to reduce rtt, i want to reduce rtt with cdn. what provider to choose.

Round-trip time (RTT) is the time it takes for the server to receive a data packet, process it, and send the client an acknowledgement that the request has been received. It is measured from the time the signal is sent till the response is received.
When a user clicks a button on a website, the request is sent to the server as a data packet. The server needs time (RTT) to process the data, generate a response, and send it back. Each action, like sending a form upon a click, may require multiple requests.
RTT determines the total network latency and helps monitor the state of data channels. A user cannot communicate with the server in less than one RTT, and the browser requires at least three round trip times to initiate a connection:
- to resolve the DNS name;
- to configure the TCP connection;
- to send an HTTP request and receive the first byte.
In some latency-sensitive services, e.g., online games, the RTT is shown on the screen.

Distance and number of intermediate nodes. A node is a single device on the network that sends and receives data. The first node is the user’s computer. A home router or routers at the district, city, or country level are often intermediate nodes. The longer the distance between the client and server, the more intermediate nodes the data must pass through and the higher the RTT.
Server and intermediate node congestion. For example, a request may be sent to a fully loaded server that is concurrently processing other requests. It can’t accept this new request until other ones are processed, which increases the RTT. The RTT includes the total time spent on sending and processing a request at each hop, so if one of the intermediate nodes is overloaded, the RTT adds up.
You never know exactly to what extent the RTT will grow based on how the infrastructure is loaded; it depends on individual data links, intermediate node types, hardware settings, and underlying protocols.
Physical link types and interferences. Physical data channels include copper, fiber optic, and radio channels. The RTT here is affected by the amount of interference. On the Wi-Fi operating frequency, the noise and other signals interfere with the useful signals, which reduces the number of packets per second. So, the RTT is likely to increase over Wi-Fi than over fiber-optics.
To measure the RTT, you can run the ping command in the command line, e.g., “ping site.com.”

Requests will be sent to the server using ICMP. Their default number is four, but it can be adjusted. The system will record the delayed time between sending each request and receiving a response and display it in milliseconds: minimum, maximum, and average.
The ping command shows the total RTT value. If you want to trace the route and measure the RTT at each individual node, you can use the tracert command (or traceroute for Linux or Mac OS). It is also can be performed via the command line.
Many factors affect RTT, making it difficult to establish a normal—the smaller the number, the better.
In online games, over 50 milliseconds are noticeable: players cannot accurately hit their targets due to network latency. Pings above 200 milliseconds matter even when users browse news feeds or place online orders: many pages open slowly and not always fully. A buyer is more likely to leave a slow website without making a purchase and never come back, which is what 79 percent of users do .
Let’s compare the pings of the two sites—the US jewelry store Fancy and the German news portal Nachrichtenleicht.de . We will ping them from Germany.

The RTT of a German news portal is almost three times lower than that of a US store because we ping from Germany. There are fewer nodes between the user and the server, which are both in the same country, so the RTT is lower.
Connect to a content delivery network (CDN). The hosting provider’s servers are usually located in the same region where most of the audience lives. But if the audience of the site grows or changes geographically, and content is requested by users who are far away from the server, RTT increases for them, and the site loading speed is slower. To increase the loading speed, use a CDN.
CDN (Content Delivery Network) is a service that caches (mostly static) content and stores it on servers in different regions. Therefore, only dynamic content is downloaded from the main source server, which is far from the user. Heavy static files—the main share of the website—are downloaded from the nearest CDN server, which reduces the RTT by up to 50 percent.

For example, the client requests content from a CDN-connected site. The resource recognizes that there is a caching server in the user’s region and that it has a cached copy of the requested content. To speed up the loading, the site substitutes links to files so that they are retrieved not from the hosting provider’s servers, but from the caching server instead since it is located closer. If the content is not in the cache, CDN downloads it directly from the hosting server, passes it to the user, and stores it in the cache. Now a client on the same network can request the resource from another device and load the content faster without having refer to the origin server.
Also, CDN is capable of load balancing: it routes requests through redundant servers if the load on the closest one is too high.
Optimize content and server apps. If your website has visitors from different countries/regions, you need a CDN to offset the increased RTT caused by long distances. In addition, the RTT is affected by the request processing time, which can be improved by the below content optimizations:
- Audit website pages for unnecessary scripts and functions, reduce them, if possible.
- Combine and simplify external CSS.
- Combine JavaScript files and use async/await keywords to optimize their processing—the HTML code first, the script later.
- Use JS and CSS for individual page types to reduce load times.
- Use the tag instead of @import url (“style.css”) commands .
- Use advanced compression media technologies: WebP for images, HEVC for video.
- Use CSS-sprites: merge images into one and show its parts on the webpage. Use special services like SpriteMe.
For fast content delivery anywhere in the world, you need a reliable CDN with a large number of points of presence. Try Gcore CDN —this is a next-generation content delivery network with over 140 PoPs on 5 continents, 30 ms average latency worldwide, and many built-in web security features. It will help to accelerate the dynamic and static content of your websites or applications, significantly reduce RTT, and make users satisfied.
Related product
Try gcore cdn.
- 150+ points of presence
- Low latency worldwide
- Dynamic content acceleration
- Smart asset optimization
- Top-notch availability
- Outstanding connectivity
Related articles
- The Development of AI Infrastructure: Transitioning from On-Site to the Cloud and Edge
- What is Managed Kubernetes
- Ways to Harm: Understanding DDoS Attacks from the Attacker’s View
Subscribe and discover the newest updates, news, and features
- Skip to primary navigation
- Skip to main content
- Skip to footer
Cyara Customer Experience Assurance Platform
Blog / CX Assurance
December 12, 2023
What is Round-trip Time and How Does it Relate to Network Latency?
Tsahi Levent-Levi, Senior Director, Product
Round-trip time (RTT) is an important metric that can indicate the quality of communications available between two end-points. It’s a metric that our team often discusses with customers because it directly relates to the service quality experienced. RTT can be impacted by a range of design decisions, especially concerning network topology. However, there is some confusion around what exactly RTT is, how it relates to latency, how it can impact your service, and how you can improve it.
What is Round-trip Time?
One of our most viewed dashboard metrics in our Cyara testRTC product suite is RTT. This is the time it takes for a packet to go from the sending endpoint to the receiving endpoint and back. There are many factors that affect RTT, including propagation delay, processing delay, queuing delay, and encoding delay. These factors are generally constant for a given pair of communicating endpoints. Additionally, network congestion can add a dynamic component to RTT.
Propagation delay is the network distance between the two endpoints. It is the route taken by the data across the various networks, through different network switches and routers to get from the sending endpoint to the receiving endpoint. Sometimes, this may be aligned with geographical distances and sometimes it may not. Propagation delay is usually the dominant component in RTT. It ranges from a few milliseconds to hundreds of milliseconds, depending on whether the endpoints are separated by just a few kilometers or by an entire ocean.
The remaining components (processing, queuing, and encoding delays) can vary by the number of nodes in the network connecting endpoints. When only a few router hops separate the endpoints, these factors are insignificant. However, the more hops, the higher the delay, since each network node needs to receive, process and route all the data towards the next hop, adding its own milliseconds of delay to the total RTT calculation.
Impact of Network Topology
In real-time communications, we must consider the impact of network topology on RTT. Any infrastructure-based topology introduces incremental delays when compared with a peer-to-peer connection. When media is anchored by a multipoint control unit MCU , SFU , or TURN server, additional processing, queuing and encoding delays occur. But, more importantly, an infrastructure topology can add significant propagation delay depending on where the server is located relative to the endpoints.

Figure 1: Infrastructure Topology
Hairpinning occurs when media is anchored in a location that is geographically remote from an endpoint, this adds significant propagation delay, when compared to a peer connection. This is why the placement of infrastructure can be critical to delivering low RTT and a high-quality user experience. The further the media server is from the sending and receiving endpoints, the higher the RTT value and the lower the service quality.

Figure 2: The media server is located further away than necessary from the sending and receiving endpoints, resulting in a high round-trip time.

Figure 3: The media server is located between the sending and receiving endpoints, resulting in a lower round-trip time.
Clearing Up a Few Misconceptions
RTT and ping time are often considered synonymous. But while ping time may provide a good estimate of RTT, it is different. This is because most ping tests are executed within the transport protocol using internet control messaging protocol (ICMP) packets. In contrast, RTT is measured at the application layer and includes the additional processing delay produced by higher level protocols and applications (e.g. HTTPS). In WebRTC, RTT on the media streams is calculated by looking at the secure real-time transport protocol (SRTP) packets themselves. This provides the closest measure to what the actual media in a session feels like in terms of RTT.
Network latency is closely related, but different from RTT. Latency is the time it takes for a packet to go from the sending endpoint to the receiving endpoint. Many factors affect the latency of a service, including:
- Network congestion
- Packet loss and jitter
- Traffic prioritization
- Server load
- Codecs and encryption
Therefore, latency is not explicitly equal to half of RTT, because delays may be asymmetrical between any two given endpoints. For example, RTT includes processing delay at the echoing endpoint.
How Does RTT Affect Your Real-time Communications Service?
As a rule of thumb, the lower the RTT, the higher the media quality for that session is. Our focus is on ensuring the delivery of live, highly interactive services and conversations. Doing that requires a low delay from the time a user speaks until the intended recipients hear the spoken words.
At Cyara, we’ve made RTT a central focus in all of our WebRTC services. We ensure it is available to you in both aggregate form (in highlight dashboards) as well as in drill down analysis charts where you can analyze RTT over time.
Read more about: Cyara testRTC , Latency , Round-Trip Time (RTT) , Web Real-Time Communication (WebRTC) , WebRTC Monitoring
Subscribe for Updates
Join our email list, and be among the first to learn about new product features, upcoming events, and innovations in AI-led CX transformation.
An official website of the United States government Here's how you know
Official websites use .gov A .gov website belongs to an official government organization in the United States.
Secure .gov websites use HTTPS A lock ( Lock A locked padlock ) or https:// means you’ve safely connected to the .gov website. Share sensitive information only on official, secure websites.
Biden-Harris Administration Announces Final Rule Requiring Automatic Refunds of Airline Tickets and Ancillary Service Fees
Rule makes it easy to get money back for cancelled or significantly changed flights, significantly delayed checked bags, and additional services not provided
WASHINGTON – The Biden-Harris Administration today announced that the U.S. Department of Transportation (DOT) has issued a final rule that requires airlines to promptly provide passengers with automatic cash refunds when owed. The new rule makes it easy for passengers to obtain refunds when airlines cancel or significantly change their flights, significantly delay their checked bags, or fail to provide the extra services they purchased.
“Passengers deserve to get their money back when an airline owes them - without headaches or haggling,” said U.S. Transportation Secretary Pete Buttigieg . “Our new rule sets a new standard to require airlines to promptly provide cash refunds to their passengers.”
The final rule creates certainty for consumers by defining the specific circumstances in which airlines must provide refunds. Prior to this rule, airlines were permitted to set their own standards for what kind of flight changes warranted a refund. As a result, refund policies differed from airline to airline, which made it difficult for passengers to know or assert their refund rights. DOT also received complaints of some airlines revising and applying less consumer-friendly refund policies during spikes in flight cancellations and changes.
Under the rule, passengers are entitled to a refund for:
- Canceled or significantly changed flights: Passengers will be entitled to a refund if their flight is canceled or significantly changed, and they do not accept alternative transportation or travel credits offered. For the first time, the rule defines “significant change.” Significant changes to a flight include departure or arrival times that are more than 3 hours domestically and 6 hours internationally; departures or arrivals from a different airport; increases in the number of connections; instances where passengers are downgraded to a lower class of service; or connections at different airports or flights on different planes that are less accessible or accommodating to a person with a disability.
- Significantly delayed baggage return: Passengers who file a mishandled baggage report will be entitled to a refund of their checked bag fee if it is not delivered within 12 hours of their domestic flight arriving at the gate, or 15-30 hours of their international flight arriving at the gate, depending on the length of the flight.
- Extra services not provided: Passengers will be entitled to a refund for the fee they paid for an extra service — such as Wi-Fi, seat selection, or inflight entertainment — if an airline fails to provide this service.
DOT’s final rule also makes it simple and straightforward for passengers to receive the money they are owed. Without this rule, consumers have to navigate a patchwork of cumbersome processes to request and receive a refund — searching through airline websites to figure out how make the request, filling out extra “digital paperwork,” or at times waiting for hours on the phone. In addition, passengers would receive a travel credit or voucher by default from some airlines instead of getting their money back, so they could not use their refund to rebook on another airline when their flight was changed or cancelled without navigating a cumbersome request process.
The final rule improves the passenger experience by requiring refunds to be:
- Automatic: Airlines must automatically issue refunds without passengers having to explicitly request them or jump through hoops.
- Prompt: Airlines and ticket agents must issue refunds within seven business days of refunds becoming due for credit card purchases and 20 calendar days for other payment methods.
- Cash or original form of payment: Airlines and ticket agents must provide refunds in cash or whatever original payment method the individual used to make the purchase, such as credit card or airline miles. Airlines may not substitute vouchers, travel credits, or other forms of compensation unless the passenger affirmatively chooses to accept alternative compensation.
- Full amount: Airlines and ticket agents must provide full refunds of the ticket purchase price, minus the value of any portion of transportation already used. The refunds must include all government-imposed taxes and fees and airline-imposed fees, regardless of whether the taxes or fees are refundable to airlines.
The final rule also requires airlines to provide prompt notifications to consumers affected by a cancelled or significantly changed flight of their right to a refund of the ticket and extra service fees, as well as any related policies.
In addition, in instances where consumers are restricted by a government or advised by a medical professional not to travel to, from, or within the United States due to a serious communicable disease, the final rule requires that airlines must provide travel credits or vouchers. Consumers may be required to provide documentary evidence to support their request. Travel vouchers or credits provided by airlines must be transferrable and valid for at least five years from the date of issuance.
The Department received a significant number of complaints against airlines and ticket agents for refusing to provide a refund or for delaying processing of refunds during and after the COVID-19 pandemic. At the height of the pandemic in 2020, refund complaints peaked at 87 percent of all air travel service complaints received by DOT. Refund problems continue to make up a substantial share of the complaints that DOT receives.
DOT’s Historic Record of Consumer Protection Under the Biden-Harris Administration
Under the Biden-Harris Administration and Secretary Buttigieg, DOT has advanced the largest expansion of airline passenger rights, issued the biggest fines against airlines for failing consumers, and returned more money to passengers in refunds and reimbursements than ever before in the Department’s history.
- Thanks to pressure from Secretary Buttigieg and DOT’s flightrights.gov dashboard, all 10 major U.S. airlines guarantee free rebooking and meals, and nine guarantee hotel accommodations when an airline issue causes a significant delay or cancellation. These are new commitments the airlines added to their customer service plans that DOT can legally ensure they adhere to and are displayed on flightrights.gov .
- Since President Biden took office, DOT has helped return more than $3 billion in refunds and reimbursements owed to airline passengers – including over $600 million to passengers affected by the Southwest Airlines holiday meltdown in 2022.
- Under Secretary Buttigieg, DOT has issued over $164 million in penalties against airlines for consumer protection violations. Between 1996 and 2020, DOT collectively issued less than $71 million in penalties against airlines for consumer protection violations.
- DOT recently launched a new partnership with a bipartisan group of state attorneys general to fast-track the review of consumer complaints, hold airlines accountable, and protect the rights of the traveling public.
- In 2023, the flight cancellation rate in the U.S. was a record low at under 1.2% — the lowest rate of flight cancellations in over 10 years despite a record amount of air travel.
- DOT is undertaking its first ever industry-wide review of airline privacy practices and its first review of airline loyalty programs.
In addition to finalizing the rules to require automatic refunds and protect against surprise fees, DOT is also pursuing rulemakings that would:
- Propose to ban family seating junk fees and guarantee that parents can sit with their children for no extra charge when they fly. Before President Biden and Secretary Buttigieg pressed airlines last year, no airline committed to guaranteeing fee-free family seating. Now, four airlines guarantee fee-free family seating, and the Department is working on its family seating junk fee ban proposal.
- Propose to make passenger compensation and amenities mandatory so that travelers are taken care of when airlines cause flight delays or cancellations.
- Expand the rights for passengers who use wheelchairs and ensure that they can travel safely and with dignity . The comment period on this proposed rule closes on May 13, 2024.
The final rule on refunds can be found at https://www.transportation.gov/airconsumer/latest-news and at regulations.gov , docket number DOT-OST-2022-0089. There are different implementation periods in this final rule ranging from six months for airlines to provide automatic refunds when owed to 12 months for airlines to provide transferable travel vouchers or credits when consumers are unable to travel for reasons related to a serious communicable disease.
Information about airline passenger rights, as well as DOT’s rules, guidance and orders, can be found at https://www.transportation.gov/airconsumer .
RBC Heritage: Final round suspended due to darkness, Monday finish underway at Harbour Town
Change Text Size
Updated: Monday, April 22, 8 a.m. ET: The final round of the RBC Heritage resumed at 8 a.m. ET.
Scheffler, chasing his fourth PGA TOUR win in five starts, authored a signature moment in the waning twilight Sunday, recovering from a hooked 4-iron second shot on the par-4 15th with a sorcerous wedge to 11 feet that he converted for an unlikely par to maintain a five-stroke lead over Wyndham Clark, Patrick Cantlay, J.T. Poston and Sahith Theegala.
Scheffler, chasing his fourth PGA TOUR win in five starts, stood 20 under for the tournament as the final round was suspended due to darkness at 7:45 p.m. Sunday, with nine players yet to complete the final round on Hilton Head Island, South Carolina.
This will be the second unscheduled Monday finish on the PGA TOUR this season and first since the Cognizant Classic in The Palm Beaches, won by Austin Eckroat. The AT&T Pebble Beach Pro-Am, won by Wyndham Clark, was shortened to 54 holes after play was unable to be contested on Sunday and Monday.
Sunday’s play at Harbour Town was initially suspended at 4:28 p.m. due to lightning in the area. The final pairing of Scheffler and Sepp Straka had completed 11 holes at the time. Players were removed from the course, with the delay ultimately lasting 2 hours and 32 minutes before play resumed at 7 p.m.
Scottie Scheffler's masterful par save at RBC Heritage
Updated: Sunday, April 21, 7 p.m. ET: The final round of the RBC Heritage resumes at 7 p.m. ET.
Updated: Sunday, April 21, 6:30 p.m. ET: The final round of the RBC Heritage will resume at 7 p.m. ET.
Updated: Sunday, April 21, 5:40 p.m. ET: The final round of the RBC Heritage will not resume at 6 p.m. ET.
Updated: Sunday, April 21, 5:28 p.m. ET: The final round of the RBC Heritage is scheduled to resume at 6 p.m. ET.
Updated: Sunday, April 21, 4:28 p.m. ET: The RBC Heritage’s final round has been suspended due to lightning in the area, with the final groups playing the back nine Sunday at Harbour Town Golf Links.
Play was suspended at 4:28 p.m. local time, with leader Scottie Scheffler playing the 12th hole. Players were taken off the course at the time of suspension.
Scheffler began the final round at 16 under, one stroke clear of Sepp Straka, and the world No. 1 turned in 3-under 33 with a chip-in eagle at the par-5 second, a two-putt birdie at the par-5 fifth and seven pars. Scheffler stood 19 under, four strokes clear of the field at the time of delay. Seven players stood 15 under.
“We were hoping to play through this; we felt like we had another 25 minutes left of this heavy rain and were then going to get a break on the back end,” said Mark Dusbabek, the PGA TOUR’s senior director lead TV Rules & Video Analyst, on the CBS broadcast. “We had lightning unfortunately pop up 4 miles away; just suddenly caught us in, so we had to stop play for this. We’re going to see how things go here and make a decision.
"The course was not unplayable. It wasn't because of the rain. It was just because the lightning popped up."
The final round of the RBC Heritage is poised to deliver fans a fantastic finish, but that might not come without a little bit of weather late in the day.
After the first three rounds of tournament golf at Harbour Town Golf Links were accompanied by sunshine and temperatures ranging from the upper 70s into the mid-80s, Sunday could bring golfers a different challenge to navigate as the tournament comes to a close.
According to the forecast, a cold front will be slowly moving southward into the Hilton Head Island area on Sunday, increasing the chances for showers and a few thunderstorms as play gets into the early to mid-afternoon hours and continuing into the evening hours. Storms could produce gusty winds and heavy rainfall. Otherwise, Sunday morning will remain dry with temperatures warming into the mid to upper 70s before falling into the 60s late in the day. Light wind Sunday morning will increase out of the north 10-15 gusting to 20-25 mph late in the day.
The final pairing of the day, Scottie Scheffler and Sepp Straka, are set to tee off at 1:55 p.m. ET. Scheffler holds a one-stroke lead at 16-under.
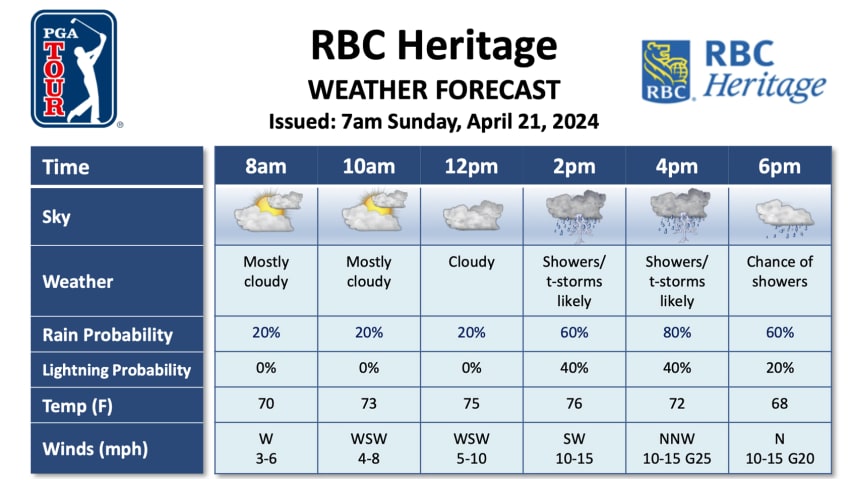
- International edition
- Australia edition
- Europe edition

Tesla shares under pressure after carmaker announces price cuts
CEO Elon Musk postpones India trip ahead of results expected to show worst performance in seven years
- Business live – latest updates
Shares in Tesla came under pressure on Monday after the electric carmaker announced a round of price cuts ahead of a difficult set of results for the company’s chief executive, Elon Musk.
Tesla stock fell as much as 5% in early trading before recovering slightly to a deficit of 3.4% in the wake of the price reductions around the globe, including slashing the cost of three of its leading electric vehicles (EVs) and its self-driving software.
Musk revealed at the weekend that he had postponed a trip to India , including a planned meeting with the prime minister, Narendra Modi, because of “very heavy obligations” at the company.
The CEO faces a key conference call with the investment community on Tuesday, when Tesla’s latest quarterly figures are expected to reveal its worst performance in seven years.
Tesla’s results come amid slowing global demand for EVs and pressure on prices from Chinese rivals. The company has already indicated a poor first quarter in terms of sales, after it revealed this month that deliveries missed market expectations by about 13% .
Tesla attempted to boost demand for its EVs late on Friday by cutting the prices of three of its five models in the US, then went on to cut prices around the world over the weekend, including in China, the Middle East, Africa and Europe.
It cut the US prices of the Model Y, Tesla’s most popular model and the top-selling EV, and also of the older and more expensive Models X and S. Those cuts reduced the starting price for a Model Y to $42,990 (£34,874), and to $72,990 for a Model S and $77,990 for a Model X. It also slashed the US price of its Full Self-Driving driver assistance software from $12,000 to $8,000.
It also emerged on Friday that Tesla was recalling all 3,878 Cybertrucks it has shipped since the vehicle was released in late 2023 because of a faulty accelerator pedal. A filing from the US safety regulator said owners had reported that the pedal pad could come loose and get lodged in the interior trim, causing the vehicle to accelerate unintentionally, increasing the risk of a crash.
Dan Ives, the managing director of the US financial services firm Wedbush Securities, said investors’ reaction to the price cuts on Monday showed they were worried “Tesla is panicking”, as well as reflecting concerns that the reductions would hit margins – a measure of profitability.
Tesla has already reacted to the slowdown by cutting more than 10% of its global workforce , equivalent to at least 14,000 roles.
Musk faces questions on Tuesday about growth in China, plans for a cheaper electric car known as the Model 2 and whether a reported switch in focus to self-driving robotaxis will affect the project. Shares in Tesla have declined more than 40% so far this year. Analysts at Wedbush wrote last week that Tuesday’s conference call represented a “moment of truth” for Musk and Tesla.
after newsletter promotion
“While we have seen much more tenuous times in the Tesla story going back to 2015, 2018, 2020 … this time is clearly a bit different as for the first time many longtime Tesla believers are giving up on the story and throwing in the white towel,” Wedbush wrote in a note to investors.
Reuters reported this month that Tesla had halted development of the Model 2, prompting Musk to post on X that “Reuters is lying”, without citing any inaccuracies.
Musk said this weekend he would reschedule the India trip to a later date this year. He had been due to visit on 21 April and 22 April, where he had been expected to announce an investment of $2bn-3bn in India, according to Reuters, with the spending plans focused on building a new plant.
Musk’s now-postponed visit to Delhi had also been expected to include meetings with executives at space industry startups. The billionaire is awaiting Indian government regulatory approvals to begin offering his Starlink satellite broadband service in the country.
- Automotive industry

How soon can Tesla get its more affordable car to the market?

Elon Musk makes unannounced visit to China

Bolsonaro supporters hit streets of Rio and hail new hero Elon Musk

Tesla cuts prices around the world as sales decline in a chaotic week

Tesla to cut 14,000 jobs as Elon Musk aims to make carmaker ‘lean and hungry’

Elon Musk faces Brazil inquiry after defying X court order
How much is elon musk to blame for tesla sales slip.

Elon Musk defends stance on diversity and free speech during tense interview

Tesla quarterly car deliveries fall for the first time in nearly four years

Tesla settles with former employee over racial discrimination claims
Most viewed.
IMAGES
VIDEO
COMMENTS
"Latency" can mean different things. Generally, it's a delay of some sort - application latency is the reaction time of an application (from input to output), network latency the delay for getting a packet from point A to B and so on. "Round-trip time" is more or less well defined as the network delay from point A to B and back .
Round-trip time (RTT) in networking is the time it takes to get a response after you initiate a network request. When you interact with an application, like when you click a button, the application sends a request to a remote data server. Then it receives a data response and displays the information to you. RTT is the total time it takes for ...
Improvements in latency can be measured in the reduction of round-trip time and by eliminating instances where roundtrips are required, such as by modifying the standard TLS/SSL handshake. The ping utility, available on virtually all computers, is a method of estimating round-trip time.
Latency measures the time it takes for a packet to travel from one point to another, while RTT measures the time it takes for a packet to make a round trip. Understanding these two terms' differences is crucial for troubleshooting network issues and improving network performance. Several tools and methods can be used to measure latency and RTT.
In telecommunications, round-trip delay (RTD) or round-trip time (RTT) is the amount of time it takes for a signal to be sent plus the amount of time it takes for acknowledgement of that signal having been received. This time delay includes propagation times for the paths between the two communication endpoints. In the context of computer networks, the signal is typically a data packet.
Round-trip time (RTT) is the duration, measured in milliseconds, from when a browser sends a request to when it receives a response from a server. It's a key performance metric for web applications and one of the main factors, along with Time to First Byte (TTFB), when measuring page load time and network latency.
Round-Trip Time is a network performance metric representing the time it takes for a data packet to travel from the source to the destination and back to the source. It is often measured in milliseconds (ms) and is a crucial parameter for determining the quality and efficiency of network connections. To understand the concept of RTT, imagine ...
Including the time it takes for a byte of data to make it from the responding computer back to the requesting computer. It is generally measured as a round trip delay. Disk latency is the time it takes from the moment a computer, usually a server, receives a request, to the time the computer returns the response.
3. Round Trip Time. The RTT is the time between sending a message from a source to a destination (start) and receiving the acknowledgment from the destination at the source point (end). We can also see RTT referred to as Round Trip Delay (RTD). Sometimes, the acknowledgment is sent from the destination to the source almost immediately after the ...
What is Round Trip Time (RTT)? Introduction. The RTT measures latency between a client and host, including the time taken for said host to respond. Tools such as ping, traceroute, and mtr are often used when measuring latency. These tools report various metrics, including latency and the Round Trip Time.. To understand RTT, you might need a refresher about TCP connections.
The round-trip time (RTT) from the client's network to the AWS Region that the WorkSpaces are in should be less than 100ms. If the RTT is between 100ms and 200ms, the user can access the WorkSpace, but performance is affected. If the RTT is between 200ms and 375ms, the performance is degraded. If the RTT exceeds 375ms, the WorkSpaces client ...
Round-trip time (RTT) is an important metric that can indicate the quality of communications available between two end-points. It's a metric that our team often discusses with customers because it directly relates to the service quality experienced. RTT can be impacted by a range of design decisions, especially concerning network topology.
ping <ip.address> -c 100. Network testing tools such as netperf can perform latency tests plus throughput tests and more. In netperf, the TCP_RR and UDP_RR (RR=request-response) tests report round-trip latency. With the -o flag, you can customize the output metrics to display the exact information you're interested in.
Network Round-Trip Time (RTT) in networking, also commonly referred to as Round-Trip Latency or simply Latency, is a crucial metric that measures the time it takes for a packet of data to travel from its source to its destination and back again to the source. RTT is typically expressed in milliseconds (ms) and is a fundamental aspect of network ...
RTT (Round-trip Time) Measure (in milliseconds) of the latency of a network — that is, the time between initiating a network request and receiving a response. High latency tends to have a greater impact than bandwidth on the end-user experience in interactive applications, such as Web browsing. See also latency.
Both capacity and latency are crucial performance metrics for the optimal operation of most networking services and applications, from online gaming to futuristic holographic-type communications. Networks worldwide have witnessed important breakthroughs in terms of capacity, including fibre introduction everywhere, new radio technologies and faster core networks. However, the impact of these ...
Round Trip Time (RTT) is the length time it takes for a data packet to be sent to a destination plus the time it takes for an acknowledgment of that packet to be received back at the origin. The RTT between a network and server can be determined by using the ping command. This will output something like: In the above example, the average round ...
Network latency is the sum of all possible delays a packet can face during data transmission.We generally express network latency as round trip time (RTT) and measure in milliseconds (ms). Network delay includes processing, queuing, transmission, and propagation delays. Let's look at the formula to calculate network latency:
Latency can either be measured as the Round Trip Time (RTT) or the Time to First Byte (TTFB): RTT is defined as the amount of time it takes a packet to get from the client to the server and back. TTFB is the amount of time it takes for the server to receive the first byte of data when the client sends a request.
Last Updated : 13 Apr, 2023. RTT (Round Trip Time) also called round-trip delay is a crucial tool in determining the health of a network. It is the time between a request for data and the display of that data. It is the duration measured in milliseconds. RTT can be analyzed and determined by pinging a certain address.
The monthly Percentile P50 round trip times between Azure regions for a 30-day window are shown in the following tabs. The latency is measured in milliseconds (ms). The current dataset was taken on April 9th, 2024, and it covers the 30-day period ending on April 9th, 2024. For readability, each table is split into tabs for groups of Azure regions.
Round-trip time (RTT) is the time it takes for the server to receive a data packet, process it, and send the client an acknowledgement that the request has been received. ... In some latency-sensitive services, e.g., online games, the RTT is shown on the screen. Ping (RTT) in World of Tanks: on the top left Factors affecting RTT. Distance and ...
Scheffler takes a one-stroke lead into Sunday at Harbour Town with an 8-under 63. Sepp Straka sits one back of him at 15-under, while Collin Morikawa sits in solo third at 14-under. Åberg carded ...
What is Round-trip Time? One of our most viewed dashboard metrics in our Cyara testRTC product suite is RTT. This is the time it takes for a packet to go from the sending endpoint to the receiving endpoint and back. There are many factors that affect RTT, including propagation delay, processing delay, queuing delay, and encoding delay.
Media Contact. Press Office. US Department of Transportation 1200 New Jersey Ave, SE Washington, DC 20590 United States. Email: [email protected] Phone: 1 (202) 366-4570 If you are deaf, hard of hearing, or have a speech disability, please dial 7-1-1 to access telecommunications relay services.
Scheffler, chasing his fourth PGA TOUR win in five starts, stood 20 under for the tournament as the final round was suspended due to darkness at 7:45 p.m. Sunday, with nine players yet to complete ...
Shares in Tesla came under pressure on Monday after the electric carmaker announced a round of price cuts ahead of a difficult set of results for the company's chief executive, Elon Musk.. Tesla ...