UN Tourism | Bringing the world closer
Share this content.
- Share this article on facebook
- Share this article on twitter
- Share this article on linkedin

Tourism on Track for Full Recovery as New Data Shows Strong Start to 2023
- All Regions
International tourism is well on its way to returning to pre-pandemic levels, with twice as many people travelling during the first quarter of 2023 than in the same period of 2022.
New Data from UNWTO: What We've Learned
The second UNWTO World Tourism Barometer of the year shows that the sector's swift recovery has continued into 2023. It shows that:
- Overall, international arrivals reached 80% of pre-pandemic levels in the first quarter of 2023
- An estimated 235 million tourists travelled internationally in the first three months, more than double the same period of 2022.
- Tourism has continued to show its resilience. Revised data for 2022 shows over 960 million tourists travelling internationally last year, meaning two-thirds (66%) of pre-pandemic numbers were recovered.
Recovery by Region in Q1 2023:
- The Middle East saw the strongest performance as the only region exceeding 2019 arrivals (+15%) and the first to recover pre-pandemic numbers in a full quarter.
- Europe reached 90% of pre-pandemic levels, driven by strong intra-regional demand.
- Africa reached 88% and the Americas about 85% of 2019 levels
- Asia and the Pacific accelerated its recovery with 54% of pre-pandemic levels, but this upward trend is set to accelerate now that most destinations, particularly China , have re-opened.
In many places, we are close to or even above pre-pandemic levels of arrivals
The UNWTO data also analyses recovery by sub-region and by destination: Southern Mediterranean Europe and North Africa have also recovered pre-pandemic levels in Q1 2023, while Western Europe, Northern Europe, Central America and the Caribbean all came close to reaching those levels.
What it Means:
UNWTO Secretary-General Zurab Pololikashvili says: "The start of the year has shown again tourism's unique ability to bounce back. In many places, we are close to or even above pre-pandemic levels of arrivals. However, we must remain alert to challenges ranging from geopolitical insecurity, staffing shortages, and the potential impact of the cost-of-living crisis on tourism, and we must ensure tourism's return delivers on its responsibilities as a solution to the climate emergency and as a driver of inclusive development."
International tourism receipts grew back to hit the USD1 trillion mark in 2022, growing 50% in real terms compared to 2021, driven by the important rebound in international travel. International visitor spending reached 64% of pre-pandemic levels (-36% compared to 2019, measured in real terms). By regions, Europe enjoyed the best results in 2022 with nearly USD 550 billion in tourism receipts (EUR 520 billion), or 87% of pre-pandemic levels. Africa recovered 75% of its pre-pandemic receipts, the Middle East 70% and the Americas 68%. Due to prolonged border shutdowns, Asian destinations earned about 28%.
International tourism receipts: Percentage of 2019 levels recovered in 2022(%) *
International tourist arrivals: percentage of 2019 levels recovered in q1 2023 (%)*, looking ahead: what's in store.
The Q1 2023 results are in line with UNWTO's forward-looking scenarios for the year which project international arrivals to recover 80% to 95% of pre-pandemic levels. UNWTO's Panel of Experts expressed their confidence in a strong peak season (May-August) in the Northern Hemisphere, reflected in the latest UNWTO Confidence Index which indicates performance for the period is on track to be even better than 2022.
However, tourism's recovery also faces some challenges . According to the UNWTO Panel of Experts, the economic situation remains the main factor weighing on the effective recovery of international tourism in 2023, with high inflation and rising oil prices translating into higher transport and accommodations costs. As a result, tourists are expected to increasingly seek value for money and travel closer to home. Uncertainty derived from the Russian aggression against Ukraine and other mounting geopolitical tensions, also continue to represent downside risks.
International Tourist Arrivals, World and Regions
Related links.
- Download the News Release in PDF
- UNWTO World Tourism Barometer - EXCERPT Volume 21 • Issue 2 • May 2023
- World Tourism Barometer (PPT version)
- The UNWTO Tourism Data Dashboard
- UNWTO World Tourism Barometer
Category tags
Related content, international tourism to reach pre-pandemic levels in 2024, international tourism to end 2023 close to 90% of pre-p..., tourism’s importance for growth highlighted in world ec..., international tourism swiftly overcoming pandemic downturn.
By Bastian Herre, Veronika Samborska and Max Roser
Tourism has massively increased in recent decades. Aviation has opened up travel from domestic to international. Before the COVID-19 pandemic, the number of international visits had more than doubled since 2000.
Tourism can be important for both the travelers and the people in the countries they visit.
For visitors, traveling can increase their understanding of and appreciation for people in other countries and their cultures.
And in many countries, many people rely on tourism for their income. In some, it is one of the largest industries.
But tourism also has externalities: it contributes to global carbon emissions and can encroach on local environments and cultures.
On this page, you can find data and visualizations on the history and current state of tourism across the world.
Interactive Charts on Tourism
Cite this work.
Our articles and data visualizations rely on work from many different people and organizations. When citing this topic page, please also cite the underlying data sources. This topic page can be cited as:
BibTeX citation
Reuse this work freely
All visualizations, data, and code produced by Our World in Data are completely open access under the Creative Commons BY license . You have the permission to use, distribute, and reproduce these in any medium, provided the source and authors are credited.
The data produced by third parties and made available by Our World in Data is subject to the license terms from the original third-party authors. We will always indicate the original source of the data in our documentation, so you should always check the license of any such third-party data before use and redistribution.
All of our charts can be embedded in any site.
Our World in Data is free and accessible for everyone.
Help us do this work by making a donation.
US Travel Header Utility Menu
- Future of Travel Mobility
- Travel Action Network
- Commission on Seamless & Secure Travel
- Travel Works
- Journey to Clean
Header Utility Social Links
- Follow us on FOLLOW US
- Follow us on Twitter
- Follow us on LinkedIn
- Follow us on Instagram
- Follow us on Facebook
User account menu
The latest travel data.
MONTHLY INSIGHTS March 04, 2024

U.S. Travel has temporarily paused our monthly data newsletter, however, the latest travel data is still available via the U.S. Travel Insights Dashboard . This dashboard is updated each month (member login required).
The U.S. Travel Insights Dashboard , developed in collaboration with Tourism Economics, is supported by more than 20 data sources. The dashboard is the most comprehensive and centralized source for high-frequency intelligence on the U.S. travel industry, tracking industry performance, travel volumes and predictive indicators of recovery including air and lodging forecasts, DMO website traffic, convention and group trends, travel spending and losses, traveler sentiment, among others to measure the health of the industry.
Key Highlights January 2024:
- Travel appetite started the year on a softer note, but overall growth continued. Air passenger growth remained positive, up 6% versus the prior year but lower than the double-digit growth seen through 2023. Foreign visits remained strong, up 24% YoY.
- Hotel room demand continued a trend of slight contraction falling 1% versus the prior year, while short-term rental demand grew 1%, a lower rate than 2023.
- A particular bright spot was that group room demand within the top 25 markets displayed solid growth of 9% relative to the prior year.
- The outlook for the economy remains fairly optimistic due to the strength of the labor market, looser financial conditions and healthy household and nonfinancial corporate balance sheets. This has filtered through to slightly higher consumer sentiment in February.
- Sentiment is also growing for upcoming leisure travel in 2024. The share of travelers reporting having travel plans within the next six months increased to 93% in January from 92% in December, according to Longwoods International’s monthly survey.
- Travel price inflation (TPI) fell slightly in January as a result of falling transportation prices. Sticky services inflation should see relief from decelerating wage growth. However, upside risks stem from rising healthcare costs, supply chain disruptions and slowing labor supply. Source: U.S. Travel Association and Tourism Economics
Member Price:
Non-Member Price: Become a member to access.
ADDITIONAL RESEARCH
Travel Price Index
Travel Forecast
Quarterly Consumer Insights
Additional monthly insights are available through the full U.S. Travel Monthly Data Report, exclusive to members. Please inquire with membership if you are interested in learning about becoming a member of U.S. Travel Association.
Travel, Tourism & Hospitality
Travel and tourism in the U.S. - statistics & facts
What are the most popular travel destinations in the u.s., u.s. travel trends, key insights.
Detailed statistics
Tourism contribution to GDP in the U.S. 2019-2022
Total travel expenditures in the U.S. 2019-2026
Number of domestic leisure and business trips in the U.S. 2019-2026
Editor’s Picks Current statistics on this topic
Current statistics on this topic.
International travel spending in the U.S. 2019-2026
Leading city destinations in the U.S. 2019, by number of international arrivals
Related topics
Recommended.
- National park tourism in the U.S.
- Millennial travel behavior in the U.S.
- Tourism worldwide
- Hotel industry worldwide
- Sustainable tourism worldwide
Recommended statistics
Industry overview.
- Basic Statistic Tourism contribution to GDP in the U.S. 2019-2022
- Premium Statistic Total travel expenditures in the U.S. 2019-2026
- Premium Statistic Direct travel spending in the U.S. 2019-2022, by traveler type
- Basic Statistic Countries that visited the U.S. the most 2019-2022
- Basic Statistic Leading outbound travel markets in the U.S. 2019-2022, country
- Basic Statistic Contribution of travel and tourism to employment in the U.S. 2019-2022
- Premium Statistic Most visited states in the U.S. 2022
Total contribution of travel and tourism to the gross domestic product (GDP) in the United States in 2019 and 2022 (in trillion U.S. dollars)
Total travel spending in the United States from 2019 to 2022, with a forecast until 2026 (in trillion U.S. dollars)
Direct travel spending in the U.S. 2019-2022, by traveler type
Total direct travel spending in the United States from 2019 to 2022, by type of traveler (in billion U.S. dollars)
Countries that visited the U.S. the most 2019-2022
Distribution of international tourist arrivals in the United States in 2019 and 2022, by country
Leading outbound travel markets in the U.S. 2019-2022, country
Distribution of outbound tourist departures in the United States in 2019 and 2022, by country
Contribution of travel and tourism to employment in the U.S. 2019-2022
Contribution of travel and tourism to employment in the United States in 2019 and 2022 (in millions)
Most visited states in the U.S. 2022
Most visited states by adults in the United States as of September 2022
Key players
- Premium Statistic Leading holiday travel provider websites in the U.S. Q2 2023, by share of voice
- Premium Statistic Most downloaded travel apps in the U.S. 2022, by aggregated number of downloads
- Premium Statistic Number of aggregated downloads of leading online travel agency apps in the U.S. 2023
- Basic Statistic American Customer Satisfaction Index for internet travel companies U.S. 2002-2023
- Premium Statistic American Customer Satisfaction Index for hotel companies in the U.S. 2008-2023
Leading holiday travel provider websites in the U.S. Q2 2023, by share of voice
Leading travel brands in the United States in 2nd quarter 2023, by share of voice
Most downloaded travel apps in the U.S. 2022, by aggregated number of downloads
Most downloaded travel apps in the United States in 2022, by aggregated number of downloads (in millions)
Number of aggregated downloads of leading online travel agency apps in the U.S. 2023
Number of aggregated downloads of selected leading online travel agency apps in the United States in 2023 (in millions)
American Customer Satisfaction Index for internet travel companies U.S. 2002-2023
American Customer Satisfaction Index Scores for internet travel companies in the United States from 2002 to 2023
American Customer Satisfaction Index for hotel companies in the U.S. 2008-2023
American Customer Satisfaction Index scores for hotel companies in the United States from 2008 to 2023
- Premium Statistic U.S. hotel and motel industry market size 2012-2022
- Premium Statistic Number of hotel jobs in the U.S. 2019-2022
- Premium Statistic ADR of hotels in the U.S. 2001-2022
- Premium Statistic Occupancy rate of the U.S. hotel industry 2001-2022
- Premium Statistic Revenue per available room of the U.S. hotel industry 2001-2022
- Premium Statistic Change in monthly number of hotel bookings in the U.S. 2020-2023
- Premium Statistic YoY monthly change in number of online hotel searches in the U.S. 2020-2023
U.S. hotel and motel industry market size 2012-2022
Market size of the hotel and motel sector in the United States from 2012 to 2022 (in billion U.S. dollars)
Number of hotel jobs in the U.S. 2019-2022
Number of hotel jobs in the United States from 2019 to 2022, with a forecast for 2023 (in millions)
ADR of hotels in the U.S. 2001-2022
Average daily rate of hotels in the United States from 2001 to 2022 (in U.S. dollars)
Occupancy rate of the U.S. hotel industry 2001-2022
Occupancy rate of the hotel industry in the United States from 2001 to 2022
Revenue per available room of the U.S. hotel industry 2001-2022
Revenue per available room (RevPAR) of hotel industry in the United States from 2001 to 2022 (in U.S. dollars)
Change in monthly number of hotel bookings in the U.S. 2020-2023
Year-over-year monthly change in number of hotel bookings in the United States from 2020 to 2023
YoY monthly change in number of online hotel searches in the U.S. 2020-2023
Year-over-year monthly change in number of online hotel searches in the United States from 2020 to 2023
Attractions
- Premium Statistic Leading museums by highest attendance worldwide 2019-2022
- Basic Statistic Most visited amusement and theme parks worldwide 2019-2022
- Premium Statistic U.S. amusement park industry market size 2011-2022
- Premium Statistic Landmarks most recommended visitors in the U.S. 2022
Leading museums by highest attendance worldwide 2019-2022
Most visited museums worldwide from 2019 to 2022 (in millions)
Most visited amusement and theme parks worldwide 2019-2022
Leading amusement and theme parks worldwide from 2019 to 2022, by attendance (in millions)
U.S. amusement park industry market size 2011-2022
Market size of the amusement park sector in the United States from 2011 to 2022 (in billion U.S. dollars)
Landmarks most recommended visitors in the U.S. 2022
Most recommended landmarks by visitors in the United States as of September 2022
City tourism
- Basic Statistic City destinations with the highest direct travel and tourism GDP worldwide 2022
- Premium Statistic World's highest-priced business travel destinations Q4 2022
- Basic Statistic Selected cities with the highest hotel rates in the U.S. as of September 2023
- Basic Statistic Most affordable cities for backpacking in the U.S. 2023, by daily price
- Premium Statistic Average price per night of Airbnb listings in selected U.S. cities 2024
- Premium Statistic Number of Airbnb listings in selected U.S. cities 2024
City destinations with the highest direct travel and tourism GDP worldwide 2022
Leading city tourism destinations worldwide in 2022, ranked by direct contribution of travel and tourism to GDP (in billion U.S. dollars)
World's highest-priced business travel destinations Q4 2022
Most expensive cities for business tourism worldwide in 4th quarter 2022, by average daily costs (in U.S. dollars)
Selected cities with the highest hotel rates in the U.S. as of September 2023
Selected cities with the most expensive hotel rates in the United States as of September 2023 (in U.S. dollars)
Most affordable cities for backpacking in the U.S. 2023, by daily price
Most affordable cities for backpacking in the United States as of January 2023, by daily price (in U.S. dollars)
Average price per night of Airbnb listings in selected U.S. cities 2024
Average price per night of Airbnb listings in selected cities in the United States as of February 2024 (in U.S. dollars)
Number of Airbnb listings in selected U.S. cities 2024
Number of Airbnb listings in selected cities in the United States as of February 2024
Sustainable tourism
- Premium Statistic Travelers who find sustainable travel important in the U.S. 2022
- Premium Statistic Share of travelers that plan to make sustainable travel choices in the U.S. 2022
- Premium Statistic How much more travelers would pay to make a trip more sustainable in the U.S. 2022
- Premium Statistic U.S. consumers who have paid extra for sustainable travel in the past two years 2022
- Premium Statistic U.S. consumers willing to pay extra for a sustainable travel provider 2022
- Premium Statistic Share of U.S. travelers that feel guilty over non-eco-friendly past travel 2022
- Premium Statistic Reasons travelers were against staying in sustainable hotels in the U.S. 2022
Travelers who find sustainable travel important in the U.S. 2022
Share of travelers that think sustainable travel is important in the United States as of February 2022
Share of travelers that plan to make sustainable travel choices in the U.S. 2022
Share of travelers that intend to make more sustainable travel decisions in the United States as of March 2022
How much more travelers would pay to make a trip more sustainable in the U.S. 2022
Extra cost travelers would be willing to pay to make a trip more carbon friendly in the United States as of March 2022
U.S. consumers who have paid extra for sustainable travel in the past two years 2022
Share of consumers that have paid extra for sustainable travel in the past two years in the United States as of February 2022
U.S. consumers willing to pay extra for a sustainable travel provider 2022
Share of consumers willing to pay extra for a sustainable travel provider in the United States as of February 2022
Share of U.S. travelers that feel guilty over non-eco-friendly past travel 2022
Share of travelers that experience guilt over past trips not being sustainable in the United States as of August 2022
Reasons travelers were against staying in sustainable hotels in the U.S. 2022
Reasons travelers were against staying in a hotel with sustainable practices in the United States as of August 2022
- Premium Statistic Priorities when choosing a leisure travel destination in the U.S. 2023, by generation
- Premium Statistic Leading destinations travelers intend to visit in the next 12 months in the U.S. 2023
- Premium Statistic Trust in travel and hospitality brands in the U.S. 2023, by brand type
- Premium Statistic American Customer Satisfaction Index: travel and tourism industries in the U.S. 2023
Priorities when choosing a leisure travel destination in the U.S. 2023, by generation
Main factors for choosing a leisure travel destination among adults in the United States as of May 2023, by generation
Leading destinations travelers intend to visit in the next 12 months in the U.S. 2023
Leading leisure travel destinations travelers intend to go to in the next 12 months in the United States as of September 2023
Trust in travel and hospitality brands in the U.S. 2023, by brand type
Level of trust in travel and hospitality brands in the United States as of September 2023, by brand type
American Customer Satisfaction Index: travel and tourism industries in the U.S. 2023
American Customer Satisfaction Index for the travel and tourism sector in the United States in 2023, by industry
Further reports Get the best reports to understand your industry
Get the best reports to understand your industry.
Mon - Fri, 9am - 6pm (EST)
Mon - Fri, 9am - 5pm (SGT)
Mon - Fri, 10:00am - 6:00pm (JST)
Mon - Fri, 9:30am - 5pm (GMT)

An official website of the United States government
- Special Topics
Travel and Tourism
Travel and tourism satellite account for 2017-2021.
The travel and tourism industry—as measured by the real output of goods and services sold directly to visitors—increased 64.4 percent in 2021 after decreasing 50.7 percent in 2020, according to the most recent statistics from BEA’s Travel and Tourism Satellite Account.

Data & Articles
- U.S. Travel and Tourism Satellite Account for 2017–2021 By Sarah Osborne - Survey of Current Business February 2023
- "U.S. Travel and Tourism Satellite Account for 2015–2019" By Sarah Osborne - Survey of Current Business December 2020
- "U.S. Travel and Tourism Satellite Account for 2015-2017" By Sarah Osborne and Seth Markowitz - Survey of Current Business June 2018
- Tourism Satellite Accounts 1998-2019
- Tourism Satellite Accounts Data Sheets A complete set of detailed annual statistics for 2017-2021 is coming soon -->
- Article Collection
Documentation
- Product Guide
Previously Published Estimates
- Data Archive This page provides access to an archive of estimates previously published by the Bureau of Economic Analysis. Please note that this archive is provided for research only. The estimates contained in this archive include revisions to prior estimates and may not reflect the most recent revision for a particular period.
- News Release Archive
What is Travel and Tourism?
Measures how much tourists spend and the prices they pay for lodging, airfare, souvenirs, and other travel-related items. These statistics also provide a snapshot of employment in the travel and tourism industries.
What’s a Satellite Account?

- TTSA Sarah Osborne (301) 278-9459
- News Media Connie O'Connell (301) 278-9003 [email protected]
- Regional Support Office for Asia and the Pacific (RSOAP)
- Member States in Asia and the Pacific
- SUSTAINABLE TOURISM OBSERVATORIES (INSTO)

Travel demand continued to show remarkable resilience and sustained recovery, amid economic and geopolitical challenges. An estimated 700 million tourists travelled internationally from January to July 2023, 43% higher than in 2022 although 16% less compared to 2019.
International tourism is experiencing a rapid recovery in Asia and the Pacific where arrivals climbed to 61% of pre-pandemic levels this period after the reopening of many destinations and source markets earlier this year. The reopening of China and other Asian markets is expected to continue boosting travel in the region and to other parts of the world.
According to the UNWTO Tourism Recovery Tracker , both international air capacity and passenger demand recovered about 84% of pre-pandemic levels through June 2023. However, the extreme weather-related events that occurred over recent months as well as the critical challenges of managing increasing tourism flows underline the need to build a more inclusive, sustainable, and resilient sector.
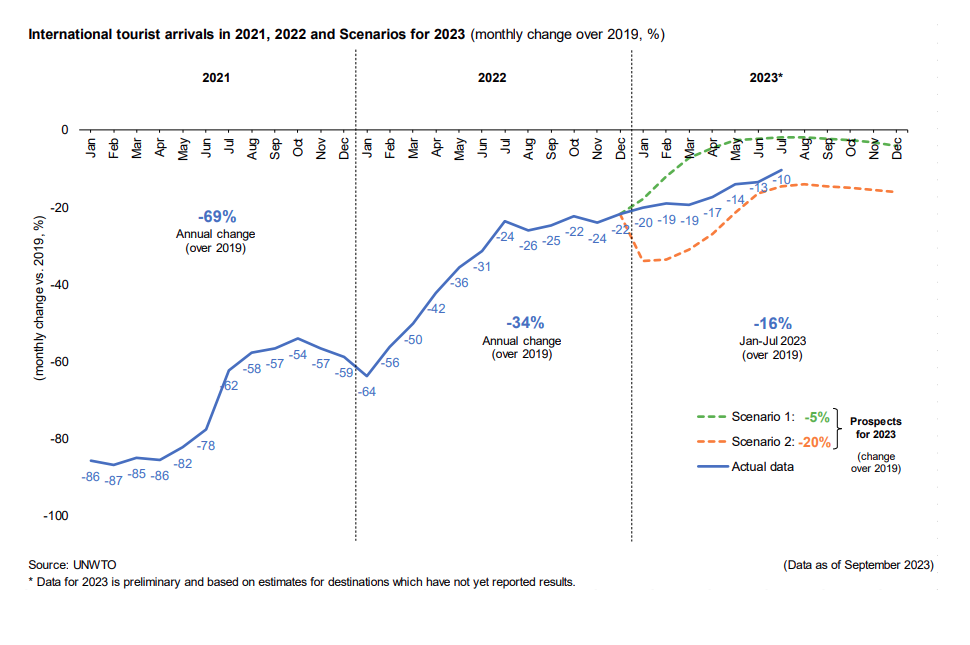
Read more on the UNWTO Tourism Barometer (September 2023 excerpt) here .
About the UNWTO World Tourism Barometer
The UNWTO World Tourism Barometer is a publication of the World Tourism Organization (UNWTO) that monitors short-term tourism trends regularly to provide global tourism stakeholders with up-to-date analysis of international tourism. The information is updated several times a year and includes an analysis of the latest data on tourism destinations (inbound tourism) and source markets (outbound tourism). The Barometer also includes three times a year Confidence Index based on the UNWTO Panel of Tourism Experts survey, which provides an evaluation of recent performance and short-term prospects for international tourism.
Source: UNWTO Press Release Barometer September 19th, 2023 (Madrid)
LEAVE A REPLY Cancel reply
Save my name, email, and website in this browser for the next time I comment.
Regional Support Office in Asia and the Pacific (RSOAP)
Rsoap a to z.
- Sustainable Tourism Observatories(INSTO)
UNWTO A to Z
- About UNWTO
- Affiliate Members
- Member States
- Tourism in the 2030 Agenda
- World Tourism Day
- Technical Cooperation
- ASIA AND THE PACIFIC
- MIDDLE EAST
- RESOURCES/SERVICES
- Sustainable Development of Tourism
- Ethics, Culture and Social Responsibility
- Market Intelligence
- Tourism Data Dashboard
- Publications
- UNWTO Academy
Partners links

© UNWTO Regional Support Office for Asia and the Pacific (RSOAP)
- Government of india
- Skip to main content

Explore Jobs
- Jobs Near Me
- Remote Jobs
- Full Time Jobs
- Part Time Jobs
- Entry Level Jobs
- Work From Home Jobs
Find Specific Jobs
- $15 Per Hour Jobs
- $20 Per Hour Jobs
- Hiring Immediately Jobs
- High School Jobs
- H1b Visa Jobs
Explore Careers
- Business And Financial
- Architecture And Engineering
- Computer And Mathematical
Explore Professions
- What They Do
- Certifications
- Demographics
Best Companies
- Health Care
- Fortune 500
Explore Companies
- CEO And Executies
- Resume Builder
- Career Advice
- Explore Majors
- Questions And Answers
- Interview Questions
25 Hotel Industry Statistics [2023]: Hotel Rate Trends And Market Data

- Wedding Industry Statistics
- Yoga Industry Statistics
- Music Industry Statistics
- Landscaping Industry Statistics
- Bicycle Industry Statistics
- Coffee Industry Statistics
- Car Rental Industry Statistics
- Home Improvement Industry Statistics
- Insurance Industry Statistics
- Supplements Industry Statistics
- Golf Industry Statistics
- Fitness Industry Statistics
- US Media And Entertainment Industry Statistics
- Firearm Industry Statistics
- Financial Services Industry Statistics
- Health And Wellness Industry Statistics
- Trucking Industry Statistics
- Wine Industry Statistics
- Pet Industry Statistics
- Mobile App Industry Statistics
- Digital Marketing Industry Statistics
- Hotel Industry Statistics
- Retail Statistics
- Robotics Industry Statistics
- Jewelry Industry Statistics
- Appointment Scheduling statistics
- Restaurant Industry Statistics
- Food Delivery Statistics
- Food Truck Industry
- Fashion Industry
- Real Estate Industry
- US Film Industry
- US Beverage Industry
- USu202fFast Food Restaurants
- US Construction Industry
- US Book Industry
- Cosmetics Industry
- US Food Retail Industry
- US Pharmaceutical Industry
- US Healthcare Industry
- Airline Industry
- Automobile Industry
- Transportation Industry Statistics
- Event Industry Statistics
- Project Management Statistics
- Oil And Gas Industry Statistics
- Nursing Home Statistics
- Nursing Shortage Statistics
- Nursing Statistics
Research Summary. The hotel industry not only reaches across the globe but also spans a wide cross-section of options ranging from budget motels to luxury resorts, making it an interesting field to study. Here are the key statistics on the hotel industry:
There are at least 187,000 hotels in the world as of 2023.
There are an estimated 17.5 million guestrooms in the world.
The global hospitality industry is worth over $4.548 trillion as of 2022.
There are about 1.6 million people employed by the U.S.’s accommodation industry.
The global travel and tourism industry was worth $4.671 trillion in 2020 , down from its $9.17 trillion value in 2019.
The average U.S. hotel occupancy rate is 64.2% as of February 2023.

Hotel Industry Statistics by Consumer Preferences
78% of millennials would rather spend their money on experiences than on things.
Hotels with a significant number of high-quality photos on their websites see a 15% increase in conversion rates.
This is compared to hotels that use few and/or low-quality photos. Including good photos of hotel rooms and amenities helps travelers know what they’re getting into and better imagine themselves there.
TripAdvisor shared that the number of photos a hotel has on its TripAdvisor profile has the most impact on traveler engagement with the listing.
More specifically, properties with at least one photo see a 138% increase in engagement and are 225% more likely to receive a booking inquiry, and those with over 100 photos see a 151% increase in engagement and are 283% more likely to receive a booking inquiry.
Europe has the highest hotel occupancy rate of any region in the world.
As of 2019, European hotels have an occupancy rate of 72.2%, meaning an average of 72.2% of all hotel rooms are occupied.
US Hotel Industry Statistics
There are 90,562 hotel and motel businesses in the U.S.
This number is a 0.4% increase from 2021, which is on trend with the average annual growth rate of 0.4% that this industry has seen from 2017 to 2022.

There are approximately 5.29 million hotel rooms in the U.S.
The U.S. hotel and motel industry is worth $177.6 billion.
This industry is predicted to grow by 33.6% throughout 2022 as it continues to recover from the COVID-19 pandemic, although it’s seen an average annual decline of 2.4% from 2017 to 2022.

The U.S. tourism industry was valued at $545.11 billion in 2020.
In 2020, U.S. hotels had an average occupancy rate of 44%.
Hotel Industry Statistics by Employment
The U.S.’s accommodation industry employs about 1.6 million people.
In Q1 2019, there were 1.352 million gross job gains in the U.S. leisure and hospitality sector.
Here are data points for each quarter from Q1 2019 through Q2 2021.
In Q1 of 2019, there were 1.22 million gross job losses in the U.S. leisure and hospitality industry.
Here are the numbers for each quarter following that through Q2 2021:
The average employee of the U.S. leisure and hospitality industry makes $19.44 an hour.
32% of U.S. leisure and hospitality industry employees have access to employer-sponsored health care.
43% get paid vacation from their employers, and 50% receive paid sick leave .
Hotel Industry Trends and Projections
In 2019, the global hotels and resorts market was worth over $1.5 trillion.
This was just before the COVID-19 pandemic caused widespread lockdowns in 2020, and it was the pinnacle of seven years of nearly continuous growth.
From 2021 to 2025, the global hotel and travel accommodation industry is projected to have a CAGR of 7%.
This will result in a market value of $1.05 trillion in 2025. In 2020, the global hotel and travel accommodation market was worth $673.02 billion, and it grew to $801.9 billion in 2021, which is a CAGR of 19.1%.
In 2020, travel and tourism contributed $4.671 trillion to the global GDP.
While this is a significant amount of money, it is also a significant decrease from the $9.17 trillion it contributed in 2019. This is a result of the 2020 COVID-19 lockdowns that significantly reduced the amount of travel in the world.

From 2008 to 2018, the number of hotels around the world has increased by nearly 14,300.

Hotel Industry Statistics FAQ
What is the growth rate of the hotel industry?
The growth rate of the hotel industry is 19.1%. This was the CAGR from 2020 to 2021 as the global hotel industry reopened after the COVID-19 pandemic lockdowns began to lift.
What are the four segments of the hospitality industry?
The four segments of the hospitality industry are Food and Beverage, Accommodation (also referred to as Lodging), Travel and Tourism, and Entertainment and Recreation.
You don’t necessarily have to be traveling to enjoy the hospitality industry’s offerings. The Food and Beverage sector, for example, includes restaurants , bowling alley food, and concessions stands, not just hotel restaurants. As a result, this is the largest sector of the hospitality industry.
The Accommodation or Lodging sector includes hotels, campgrounds, rental homes, and any other facility that gives people a place to sleep. This includes resorts, motels, and hostels all alike.
The Travel and Tourism sector covers the actual act of traveling via airlines, cruise ships, trains, taxis, and more. Whether you’re traveling for leisure or business, chances are you’ll utilize at least one of travel and tourism’s offerings on a trip.
The last sector of the hospitality industry is Entertainment and Recreation. This sector is made up of all the activities that people do just for the enjoyment of it. These include:
Swimming pools
Spectator sports
Movie theaters
Participatory sports (e.g., scuba diving, golf, tennis)
Amusement parks
How many American hospitality workers were fired or laid off in 2020?
10.65 million American hospitality workers were fired or laid off in 2020. While About 1.2 to 1.4 million people in this industry lost their jobs each quarter throughout 2019, 1.695 found themselves unemployed in Q1 2020, and a whopping 6.331 million were suddenly unemployed in Q2 2020 due to the COVID-19 pandemic lockdowns.
Is the hotel industry recovering?
Yes, the hotel industry is recovering. The global hotel and travel accommodation industry is expected to have a CAGR of 7% from 2021 to 2025.
What are the latest trends in the hotel industry?
The latest trends in the hotel industry are high-tech, green facilities, alternative accommodation options, and incorporating experiences into hotel stays.
Hotels are beginning to implement more and more smart technology, whether it’s a keyless entry or turning on the AC with an app. In addition, many hotels are looking for ways to reduce their carbon footprint by conserving water, reducing single-use plastics, and earning their LEED certifications.
Another hotel industry trend is that travelers (especially millennials) are looking more toward alternative accommodation options, whether that’s a rental house or villa, a mobile home, or hotels with a personality that reflect the local culture rather than standardized branding.
Hotels are responding to this by focusing on opening boutique hotels and facilities that bring unique elements to their decor, amenities, and even floor plans.
The hotel industry is a major player in the global and U.S. economies. In 2022, the global hotel industry was worth more than $4.548 trillion and is projected to see a CAGR of 7% from 2021 to 2025. In the U.S. alone, the hotel and motel industry is worth $177.6 billion, and the tourism industry is worth $545.11 billion.
Lockdowns in response to the COVID-19 pandemic in 2020 significantly impacted this industry. The worldwide travel and tourism industry contributed $4.671 trillion to the global GDP in 2020, which is just over half the amount it contributed in 2019 ($9.17 trillion).
In the U.S., over seven million leisure and hospitality industry employees lost their jobs during the first six months of 2020, compared to the just over five million that found themselves unemployed throughout all of 2019. Hotel occupancy rates also dropped by 33.3% from 2019 to 2020.
Eventbrite. “ Millennials: Fueling the Experience Economy. ” Accessed on February 16, 2022.
Medium . “ The Importance of Imagery on Hotel Websites. ” Accessed on February 16, 2022.
Frederic Gonzalo. “ Photos Impact Bookings More Than Reviews. ” Accessed on February 16, 2022.
Statista. “ Occupancy Rate of the Hotel Industry Worldwide From 2008 to 2019, by Region. ” Accessed on February 16, 2022.
IBISWorld. “ Hotels & Motels in the U.S. – Number of Businesses 2005-2027. ” Accessed on February 16, 2022.
Statista. “ Number of Hotel Rooms in the United States From 2017 to 2020, by Chain Scale Segment. ” Accessed on February 16, 2022.
IBISWorld. “ Hotels & Motels in the U.S. – Market Size 2005-2027. ” Accessed on February 16, 2022.
Statista. “ Market Size of the Tourism Sector in the United States From 2011 to 2020, with a Forecast for 2021. ” Accessed on February 16, 2022.
Statista. “ Occupancy Rate of Hotel Industry in the United States From 2001 to 2020. ” Accessed on February 16, 2022.
U.S. Bureau of Labor Statistics. “ Accommodation: NAICS 721. ” Accessed on February 16, 2022.
U.S. Bureau of Labor Statistics. “ Economic News Release: Employment Situation Summary. ” Accessed on February 16, 2022.
U.S. Bureau of Labor Statistics. “ Databases, Tables & Calculators by Subject: Gross Job Gains for the Leisure and Hospitality Sector in the U.S. (Rounded to the Nearest Thousands.) ” Accessed on February 16, 2022.
U.S. Bureau of Labor Statistics. “ Databases, Tables & Calculators by Subject: Gross Job Losses for the Leisure and Hospitality Sector in the U.S. (Rounded to the Nearest Thousands). ” Accessed on February 16, 2022.
U.S. Bureau of Labor Statistics. “ Leisure and Hospitality. ” Accessed on February 16, 2022.
IBISWorld. “ Global Hotels & Resorts – Market Size 2005-2027. ” Accessed on February 16, 2022.
Globe Newswire. “ Global Hotel and Other Travel Accommodation Market Report 2021: Market is Expected to Grow From $673.02 Billion in 2020 to $801.9 Billion in 2021 – Long-term Forecast to 2025 & 2030. ” Accessed on February 16, 2022.
Statista. “ Total Contribution of Travel and Tourism to Gross Domestic Product (GDP) Worldwide From 2006 to 2020. ” Accessed on February 16, 2022.
Statista. “ Total Number of Hotels Worldwide From 2008 to 2018. ” Accessed on February 16, 2022.
Hospitality Net. “ What Are the 4 Segments of the Hospitality Industry. ” Accessed on February 16, 2022.
Hotel Tech Report. “ 100 Hotel Trends You Need To Watch in 2022 & Beyond. ” Accessed on February 16, 2022.
How useful was this post?
Click on a star to rate it!
Average rating / 5. Vote count:
No votes so far! Be the first to rate this post.

Abby is a writer who is passionate about the power of story. Whether it’s communicating complicated topics in a clear way or helping readers connect with another person or place from the comfort of their couch. Abby attended Oral Roberts University in Tulsa, Oklahoma, where she earned a degree in writing with concentrations in journalism and business.
Recent Job Searches
- Registered Nurse Jobs Resume Location
- Truck Driver Jobs Resume Location
- Call Center Representative Jobs Resume Location
- Customer Service Representative Jobs Resume
- Delivery Driver Jobs Resume Location
- Warehouse Worker Jobs Resume Location
- Account Executive Jobs Resume Location
- Sales Associate Jobs Resume Location
- Licensed Practical Nurse Jobs Resume Location
- Company Driver Jobs Resume
Related posts

25+ Alarming Age Discrimination Statistics [2023]
How Many Freelancers Are There In The U.S.?
Major Marriage Metrics: How Your Major Affects Your Marriage Rate

22 ZipRecruiter Statistics [2023]: Facts, Users, Revenue, And More
- Career Advice >
- Industry Statistics >
- [ April 28, 2024 ] WATCH LIVE: Court Is Now In Session From the Brevard County Jail Complex Brevard Crime News
- [ April 28, 2024 ] Arrests In Brevard County: April 27, 2024 – Suspects Presumed Innocent Until Proven Guilty Brevard Crime News
- [ April 28, 2024 ] HOT OFF THE PRESS! Enjoy Space Coast Daily, Brevard County’s Best and Most Read Magazine Brevard Business News
- [ April 28, 2024 ] 4EVER YOUNG Anti-Aging Solutions Merritt Island Offering Mother’s Day Specials Brevard News
- [ April 28, 2024 ] Platinum Coast Orchid Society 59th Annual Orchid Show Set May 3-5 at Kiwanis Island Park on Merritt Island Brevard Business News
Home » Home » PETER CRANIS: Economic Impact of Tourism on Brevard in 2023 Was $4.6 Billion, Visitor Spending $2.95 Billion
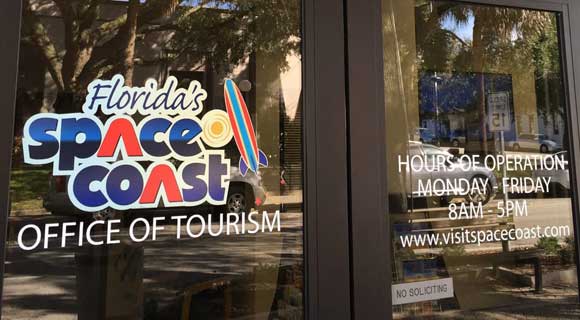
PETER CRANIS: Economic Impact of Tourism on Brevard in 2023 Was $4.6 Billion, Visitor Spending $2.95 Billion
By Peter Cranis, Space Coast Office of Tourism Executive Director // April 27, 2024
industry supports 46,000 direct and indirect jobs with wages of nearly $1.5 billion

BREVARD COUNTY, FLORIDA – We recently completed a Visitor and Economic Impact Study with 2,500 visitors being interviewed. This is the most comprehensive study we have done since COVID and it revealed some very interesting data.
First of all, the overall economic impact of tourism on the County was calculated at $4.6 billion with visitor spending at $2.95 billion. Overnight visitors accounted for nearly 3 million room nights in 2023 including hotel/motel and vacation rental.
The report also shows the industry supports nearly 46,000 direct and indirect jobs with wages of nearly $1.5 billion.
In terms of trip planning 63% of visitors saw something from the Space Coast Office of Tourism prior to coming – whether it was our website, social media, or other advertising/promotions we have done.
In terms of origin of visitors, 37% come from within Florida, 17% from the Southeast, 12% from the Northeast, 17% from the Midwest, 12% from the West, and 5% are from international markets, mostly Canada, UK and Germany. The split between flying here or driving is 54%/46%.
Visitors stay here 4.5 nights on average and are in travel parties of 3.1 people, 47% having children in their party. On average, each travel party spends $2,762 which is $197 per person per day, or $891 per trip.
In terms of accommodations, 36% stay in hotel motel, 28% with friends and family, and 26% in vacation rental. They stay in Cocoa Beach/Cape Canaveral (33%), Melbourne (14%), Titusville (12%), Melbourne Beach/South Beaches (10%), and Palm Bay (9%).
While here they engage in beach activities (68%), go shopping (61%) and sightseeing (48%), watch a rocket launch (41%), do some kind of outdoor activity (40%), go to Kennedy Space Center (29%), take an overnight cruise (25%), or participate in watersports (22%). Other things they do include going to a museum, the zoo, fishing, golf, play in a sporting event, or a business activity.
They enjoy being here and 93% said they would return here, 79% said within the next 12 months. Of those that took an overnight cruise, 91% stayed here overnight either before or after the cruise and 27% said they stayed both before and after. There are a lot more data points we collected, but these are the highlights. We will share more in future stories.
CLICK HERE FOR MORE INFORMATION
– Peter Cranis, Space Coast Office of Tourism Executive Director
Similar Stories
FEATURED STORIES

Click Here to Sign Up for Text Alerts
Or Signup Below For Email Alerts!
Advancing social justice, promoting decent work ILO is a specialized agency of the United Nations
Migrated Content
ILOSTAT Blog
In-depth tourism employment data can provide valuable insights for shaping policies that benefit enterprises and improve the welfare of workers in the industry.
26 September 2023
This destination in Northeast India has witnessed record-breaking tourist arrivals in 2024 so far
With a promising start in 2024, the sikkim tourism department is projecting a potential milestone of 1.2 million tourist arrivals by the year-end if the current growth rate persists..


Cruise tourism footfall at highest-ever 4.7 lakh in 2023-24
N EW DELHI: Cruise tourism in India has hit a new high with footfall touching 4.7 lakh in 2023-24, higher than the pre-pandemic period. Interestingly, govt data showed that the share of domestic tourists had increased by almost 85% compared to 2019-20, indicating how domestic cruise tourism is becoming popular in the country.
As per govt data, the share of domestic and international cruise tourists was almost 50-50 in 2019-20 when the total footfall was a little over 4.2 lakh. During the pandemic year, there was no footfall as services stopped. In 2021-22, domestic cruise footfall revived, but there were no international tourists.
Data showed that while domestic cruise footfall increased to almost 4 lakh in 2022-23, the number of international tourists was barely 29,026. In the last financial year, international tourist footfall increased more than three-fold to touch 98,344. “There is a huge opportunity in this sector. Several steps have been taken, including guaranteed berths to cruise ships over others, concessional and uniform rationalised berthing rate for all major ports, e-visa and on-arrival visa facilities and single e-landing card introduced that’s valid for all ports in cruise itinerary,” a source said.
Officials said there were regular calls by international cruise ships in Mumbai, Goa, New Mangaluru and Kochi ports. Domestic cruises were operational from Sep 2021 on Mumbai-Goa, Mumbai-Diu, Mumbai-Kochi, Mumbai-Lakshadweep, Mumbai-High Seas and Chennai-Vizag routes. Moreover, nine waterways are in operation for river cruise tourism, including Varanasi-Haldia stretch of Ganga and Dhubri-Sadiya stretch of Brahmaputra.
Govt also plans to develop theme-based tourist circuits like Gujarat pilgrimage tours, west coast cultural and scenic tours, south coast ayurvedic wellness tours and east coast heritage tours.
For more news like this visit TOI . Get all the Latest News , City News , India News , Business News , and Sports News . For Entertainment News , TV News , and Lifestyle Tips visit Etimes

COMMENTS
New Data from UNWTO: What We've Learned. The second UNWTO World Tourism Barometer of the year shows that the sector's swift recovery has continued into 2023. It shows that: An estimated 235 million tourists travelled internationally in the first three months, more than double the same period of 2022. Tourism has continued to show its resilience.
According to new data from UNWTO, more than 900 million tourists traveled internationally in 2022 - double the number recorded in 2021.. Tourism recovery is foreseen to continue throughout 2023 even as the sector faces economic, health and geopolitical challenges. The recent lifting of COVID-19 related travel restrictions in China, the world's largest outbound market in 2019, is a ...
An estimated 975 million tourists travelled internationally between January and September. 2023, an increase of 38% over the same months of 2022, though 13% fewer than in 2019 (UNWTO Tourism Barometer November 2023-Excerpt). Overall, tourism recovered 87% of pre-pandemic levels in January-September 2023.
According to recent UNWTO data, the tourism industry is well on its way to a full recovery, with a strong start to 2023. International tourism is well on its way to returning to pre-pandemic levels, with twice as many people traveling during the first quarter of 2023 than in the same period of 2022. The second tourism barometer of 2023 shows an ...
The world's leading organisations rely on our subscription services for data, analysis and forecasts that keep them informed about emerging issues around the world. ... Tourism outlook 2023 Turbulence in the travel industry • Global tourism arrivals will rise by 30% in 2023, following 60% growth in 2022, but they will still not ...
• Tourism was one of the most affected sectors by the pandemic, with businesses, employment and livelihoods around the world severely impacted by the crisis. Figure 2: International tourist arrivals and tourism receipts, 2000-2022 Source: World Tourism Organization (UNWTO) Data as of October 2023
Tourism outlook 2023. Global tourism arrivals will increase by 30% in 2023, following growth of 60% in 2022, but will remain below pre-pandemic levels. The economic downturn, sanctions on Russia, and China's zero-covid strategy will delay recovery. EIU's guide to tourism in 2023 provides a comprehensive view of the challenges, opportunities ...
Data on inbound, domestic and outbound tourism is available, as well as on tourism industries, employment and complementary indicators. All statistical tables available are displayed and can be accessed individually. Please find the detailed list of the countries updated here (November 2023).
The 2023 edition of the Yearbook of Tourism Statistics presents data on total arrivals and overnight stays of inbound tourism for 187 countries and territories, broken down in both cases by country of origin, while the COVID-19 pandemic has been taken into account, as it has caused an unprecedented situation worldwide that has especially ...
Tourism has massively increased in recent decades. Aviation has opened up travel from domestic to international. Before the COVID-19 pandemic, the number of international visits had more than doubled since 2000. Tourism can be important for both the travelers and the people in the countries they visit. For visitors, traveling can increase their ...
Sentiment is also growing for upcoming leisure travel in 2024. The share of travelers reporting having travel plans within the next six months increased to 93% in January from 92% in December, according to Longwoods International's monthly survey. Travel price inflation (TPI) fell slightly in January as a result of falling transportation prices.
Directly accessible data for 170 industries from 150+ countries and over 1 Mio. facts. ... American Customer Satisfaction Index: travel and tourism industries in the U.S. 2023.
Travel and Tourism Satellite Account for 2017-2021. The travel and tourism industry—as measured by the real output of goods and services sold directly to visitors—increased 64.4 percent in 2021 after decreasing 50.7 percent in 2020, according to the most recent statistics from BEA's Travel and Tourism Satellite Account.
International tourism maintains strong momentum with 84% recovery up to July 2023. Travel demand continued to show remarkable resilience and sustained recovery, amid economic and geopolitical challenges. An estimated 700 million tourists travelled internationally from January to July 2023, 43% higher than in 2022 although 16% less compared to 2019.
Tourism acts as a catalyst for cultural exchange, champions local businesses, and supports the preservation of natural attractions. The forthcoming 2023 data could illustrate how tourism contributed to these multifaceted aspects, underscoring its comprehensive influence on the state's overall well-being.
Complementary (macroeconomic) indicators. The 2023 Edition of the Compendium of Tourism Statistics presents in English, French and Spanish data for 194 countries from 2017 to 2021. Moreover, in this edition, the context of the COVID-19 pandemic is taken into account, as it has caused an unprecedented situation worldwide that has especially ...
Monthly Tourism Statistics, May 2023 : Monthly Tourism Statistics, May 2023.pdf: 10/08/2023 - 11/08/2023: 9 : Monthly Tourism Statistics, April 2023 : Monthly Tourism Statistics, April 2023.pdf: 15/06/2023: 10 : Monthly Tourism Statistics, March 2023 : Monthly Tourism Statistics, March 2023 (1).pdf ...
The global travel and tourism industry was worth $4.671 trillion in 2020, down from its $9.17 trillion value in 2019. The average U.S. hotel occupancy rate is 64.2% as of February 2023. For further analysis, we broke down the data in the following ways: Industry | Employment | Trends and Projections. Hotel Industry Statistics by Consumer ...
STR: lodging data; Sports attendance data "The sport tourism industry continued to grow in 2023, increasing by 7% over sports traveler volume in 2022," said John David, President & CEO of ...
This is the most comprehensive study we have done since COVID and it revealed some very interesting data. Download App. News; Crime. ... Economic Impact of Tourism on Brevard in 2023 Was $4.6 ...
In-depth tourism employment data can provide valuable insights for shaping policies that benefit enterprises and improve the welfare of workers in the industry. 26 September 2023. Facebook Twitter Linkedin Advancing social justice, promoting decent work ILO is a specialized agency of the United Nations ...
According to Tourism Sikkim data, ther has been a consistent upward trend in tourist arrivals over the past decade. Starting from 576,749 visitors in 2013, the numbers surged to a peak of 1,625,573 in 2023. With a promising start in 2024, projections indicate a potential milestone of 1.2 million tourists by year-end if the current growth rate persists.
NEW DELHI: Cruise tourism in India has hit a new high with footfall touching 4.7 lakh in 2023-24, higher than the pre-pandemic period. Interestingly, govt data showed that the share of domestic ...