- The Best Tech Gifts Under $100
- Traveling? Get These Gadgets!

How to Activate the iPhone Debug Console or Web Inspector
Use Safari's web developer tools to study problematic websites
:max_bytes(150000):strip_icc():format(webp)/ScottOrgera-f7aca23cc84a4ea9a3f9e2ebd93bd690.jpg)
- Saint Mary-of-the-Woods College
- Switching from Android
What to Know
- Activate Web Inspector on iOS: Go to Settings > Safari > Advanced and move the Web Inspector toggle switch to the On position.
- Use Web Inspector on macOS: Connect your iOS device to a Mac and choose the URL to inspect from the Develop menu.
If you run into a bug or another issue with a website on Safari mobile, use the Web Inspector tool to investigate. This article explains how to use the Safari console for iPhone to debug errors with the help of your Mac computer. Instructions apply to iPhones with iOS 14, iOS 12, or iOS 11, and well as Macs with macOS Big Sur (11.0), macOS Catalina (10.15), or macOS Mojave (10.14).
Activate Web Inspector on Your iPhone or Other iOS Device
The Web Inspector is disabled by default since most iPhone users have no use for it. However, if you're a developer or you're curious, you can activate it in a few short steps. Here's how:
Open the iPhone Settings menu.
On an iPhone with an early version of iOS, access the Debug Console through Settings > Safari > Developer > Debug Console . When Safari on the iPhone detects CSS, HTML, and JavaScript errors, details of each display in the debugger.
Scroll down and tap Safari to open the screen that contains everything related to the Safari web browser on your iPhone, iPad, or iPod touch.
Scroll to the bottom of the page and select Advanced .
Move the Web Inspector toggle switch to the On position.
Connect Your iOS Device to Safari on a Mac
To use the Web Inspector, connect your iPhone or another iOS device to a Mac that has the Safari web browser and enable the Develop menu .
With Safari open, select Safari from the menu bar and choose Preferences .
Select the Advanced tab.
Select the Show Develop menu in menu bar check box and close the settings window.
From the Safari menu bar, select Develop and choose the name of your attached iOS device, then select the URL that appears under Safari to open the debug console for that site.
After you connect your device, use your Mac to inspect the website you want to debug and have it open in the Safari mobile browser.
What Is Web Inspector?
Web developers use Web Inspector to modify, debug, and optimize websites on Macs and iOS devices. With Web Inspector open, developers can inspect the resources on a web page. The Web Inspector window contains editable HTML and notes regarding the styles and layers of the web page in a separate panel.
Before iOS 6, the iPhone Safari web browser had a built-in Debug Console that developers used to find web page defects. Recent versions of iOS use Web Inspector instead.
With Safari 9 and OS X Mavericks (10.9), Apple introduced Responsive Design Mode in Web Inspector. Developers use this built-in simulator to preview how web pages scale to different screen sizes, resolutions, and orientations.
To set up Web Inspector on your iPad, open your iPad's Settings and select Safari > Advanced , then turn Web Inspector On . Connect the iPad to a Mac computer, then open Safari on the Mac and select Safari > Preferences > Advanced , then turn on Show Develop menu in menu bar .
You cannot just connect your iPhone to a Windows PC and start using Web Inspector through Chrome like you can with a Mac. Installing package manager software can provide you a sort of workaround, but it's not recommended unless you're familiar with the package management app you intend to use.
Get the Latest Tech News Delivered Every Day
- Add More Features by Turning on Safari's Develop Menu
- 4 Ways to Play Fortnite on iPhone
- How to Activate and Use Responsive Design Mode in Safari
- How to Inspect an Element on a Mac
- What Is Safari?
- How to Clear Search History on iPhone
- How to Use Web Browser Developer Tools
- How to Disable JavaScript in Safari for iPhone
- 10 Hidden Features in macOS Sonoma
- How to Manage History and Browsing Data on iPhone
- How to View HTML Source in Safari
- How to Manage Cookies in the Safari Browser
- How to Change Your Homepage in Safari
- How to Clear Private Data, Caches, and Cookies on Mac
- How to Reset Safari to Default Settings
- How to Manage Your Browsing History in Safari

How to Use React DevTools in Safari
Published on Jun 09, 2023 in platforms by Lucien Chemaly 11 minute read
React is commonly used for the frontend in static site generators like Gatsby and now WordPress . React DevTools is a set of developer tools with a multitude of features that can make your workflow more efficient and help you debug and optimize your code.
However, if you use Safari, you may be disappointed to learn that there is no browser extension for React DevTools like there is in Chrome and Firefox.
Fortunately, there is a solution. You can still use standalone React DevTools to connect to your site in Safari. This practical tool is also useful for debugging non-browser-based React applications, like React Native apps. It can help simplify the process of optimizing and debugging your code, making your workflow more efficient.
In this article, you’ll learn how to install and use the standalone version of React DevTools to debug a React application running in Safari. In addition, the article also highlights the differences between the standalone version and the Chrome extension, as well as some limitations of the tools.
Use Cases for Debugging React Apps
The standalone version of React DevTools is a separate application that provides a powerful set of debugging and inspection tools for React applications. It’s independent of any specific browser and can be used across various platforms and environments. This makes it a versatile option for developers who need to debug their React apps in different contexts.
Some of the use cases for the standalone version of React DevTools include:
- Debugging non-browser-based React apps: The standalone version of React DevTools is particularly useful when debugging React Native applications because it is platform-independent and can connect to apps running on iOS or Android devices. For example, you can use it to determine why a specific component of your React Native app isn’t rendering correctly on an iOS device. You can use React DevTools to inspect the component tree, check component props and state, and identify issues with styling or logic that may be causing the rendering problem.
- Debugging React apps in Safari: Safari is a widely used browser, especially among macOS users. Although Safari has its own set of developer tools, it doesn’t have extensions or support for React applications like Chrome or Firefox. The standalone version of React DevTools can be used to debug React applications running in Safari, as it provides developers with a powerful set of tools to inspect components and diagnose issues. For instance, if a specific UI component in your React app doesn’t behave as expected when viewed in Safari, you can use React DevTools to inspect the component in question. You can check its state and props and identify any issues.
- Debugging server-rendered React apps: In most static site generators, React apps are server-rendered, which means components are rendered on the server side and sent as HTML to the client. In these scenarios, the standalone version of React DevTools can help you debug issues related to server-rendered components. For example, if you’re using a solution like Next.js or React Server Components to perform server-side rendering, you can use the standalone version of React DevTools to inspect the rendered components and identify issues related to data fetching, state management, or rendering logic.
How to Debug a React App in Safari
The following tutorial explains how to use the standalone version of React DevTools to debug a React application running in Safari. By the end, you’ll be equipped with the knowledge and tools you need to confidently debug your React application.
Prerequisites
To complete this tutorial, you’ll need:
- A Mac running Safari
- A code editor, such as Visual Studio Code
- Git installed on your machine
- Node.js and npm (the Node package manager) installed on your system
To verify the installation of Node.js and npm, execute these commands in your shell or terminal:
If they aren’t installed, download and install Node.js , which also automatically installs npm. This tutorial uses Node version 18.12.1 and npm version 8.19.2.
Creating a React Demo Application
You’ll first need to set up a basic React demo application, which you’ll run and debug in your Safari browser using the standalone version of React DevTools.
Create a new React project using Create React App by executing this command:
This command will generate a new folder with the specified name and populate it with boilerplate code for a React application.
Change the current directory to your newly created project folder by running the following command:
Execute the following command to start the development server:
Your React application should now be live at http://localhost:3000/ . Use your Safari browser to open the application:

Any modifications made to the source code will trigger an automatic page refresh.
Connecting Standalone React DevTools to Your App in Safari
To connect React DevTools to your app in Safari, you first need to install the standalone React DevTools package using npm from your terminal or shell:
Run React DevTools with this command:
After you run the command, you’ll get the following screen telling you to add an additional script to your React DOM :

This tutorial uses the script with the localhost link ( <script src="http://localhost:8097"></script> ) to connect the React application, but the LAN IP address also works. Since you’re not working with a mobile application, the localhost link will work just fine.
Go to your source project and open the index.html file in the public folder. Add the localhost link just after the <head> tag, then open React DevTools. You should see the following in the Components section:

Creating a User Listing
Once you have connected React DevTools to your application, you can use the various features it provides. These features include the ability to inspect the component tree, examine component state and props, and profile component performance.
As the sample application doesn’t have many components, you’ll only see the App component in the tree. To explore more features of React DevTools, you’ll need to add more components.
To add a User component, create a file named User.js in the src folder and add the following code to it:
This component displays user information, such as first name, last name, age, and date of birth (DOB).
You’ll now create a UsersList component that utilizes the User component to display the list of users. Create a file named UsersList.js in the src folder and add the following code to it:
To populate the list of users, you need to create some dummy data and wrap the UsersList component in the App component. To do this, replace the code in App.js with the following:
Note: The App component renders the UsersList component, which in turn renders each User component for every user in the list.
The application in your Safari browser should look like the following:

Debugging and Inspecting Your App
Now that your application is ready, you can start debugging it with React DevTools.
If you open React DevTools, you should see your application tree. It begins with the App component at the top, followed by the UsersList component, and ends with the User component:

If you click the UsersList component in the tree, the props that are passed to the component will be displayed in the right pane. In this case, the props include the array of users from your dummy data:

Clicking a User component displays the props that it passes (the user object in this case). You can click any of three User components and check their relative props:

When you use React DevTools to debug your application, it’s important to understand the application tree and how it represents the component hierarchy. The application tree can help you quickly identify rendering issues and data flow by providing a visual representation of the components. You can inspect the props and state of each component to pinpoint bugs and troubleshoot issues that may arise.
Additionally, you can pin the location of a selected component in your browser by clicking the eye icon in React DevTools:

Once this has been activated, it will highlight the component in light blue in your browser:

You can also log the selected component in the console by clicking the bug icon in React DevTools:

The following image shows the results in the browser when you click the bug icon:

Using React DevTools, you can gain a better understanding of the structure and behavior of your applications. You can also more easily identify and fix bugs and performance issues. The standalone version is particularly useful because it can be used with any React application, whether it’s running locally or on a remote server, and it provides a separate, dedicated window for debugging purposes. Overall, the standalone version of React DevTools is a practical tool for developing and debugging React applications.
Differences between Standalone React DevTools and the Chrome Extension
If you use the standalone version of React DevTools, you’ll be able to use it with any browser, not just Safari. It also offers more customization options and flexibility compared to the Chrome extension. The following are some other differences between the two versions:
- Cross-platform compatibility: The standalone version of React DevTools is designed to work across various platforms, including browsers and devices, enabling a broader range of debugging and development possibilities. Chrome extensions, on the other hand, are limited to working within the Chrome browser environment.
- Ease of setup and connection: Chrome extensions are designed to integrate seamlessly with the browser, so using the extension version makes it easy to detect and connect to React apps running in the browser. The standalone version of React DevTools often requires manual configuration to connect to the target app, which can be more time-consuming and error-prone.
- Updates and maintenance: These two versions of React DevTools may have different release schedules and update processes. Chrome extensions typically update automatically with the browser, while the standalone version may require manual updates.
Limitations of Standalone React DevTools
It’s also important to be aware that the standalone version of React DevTools has some limitations. For instance, the tool may not work as effectively with certain types of components, such as those built with third-party libraries. You may need to use additional tools or methods to gather the necessary information if the tool provides limited data.
The following are some of the most notable limitations:
- Browser-specific features: The standalone version of React DevTools may lack some browser-specific features, such as network request inspection, JavaScript debugging, or browser performance profiling. For these features, developers need to use the browser’s built-in developer tools or rely on other debugging solutions tailored for the specific browser.
- Integration with browser environment: The standalone version doesn’t have the same level of integration with the browser environment as the extensions. Certain tasks, like interacting with browser APIs or manipulating the DOM, may be more challenging or impossible to accomplish using the standalone version.
- Learning curve: Due to differences in features, interface, and setup process, developers may need to invest additional time in learning how to use the standalone version of React DevTools. This may slow down their development process, especially if they are already familiar with the Chrome extension.
- Performance and resource usage: The standalone version of React DevTools may have different performance characteristics and resource usage compared to the Chrome extension version. Depending on the specific tools and configurations used, developers may experience varying levels of performance and resource consumption, which can impact their development experience.
By keeping these limitations in mind, you can adjust your approach and optimize your code more effectively. For instance, you can use alternative tools or workarounds to gather the information you need.
The standalone version of React DevTools offers a versatile solution for developers who need a powerful and flexible set of debugging tools, whether they’re working on browser-based React apps or non-browser-based applications like React Native apps.
This article introduced the standalone version of React DevTools and demonstrated how to use it to debug a React app running in Safari. You should now be comfortable with setting up, connecting, and using React DevTools to inspect and debug your React applications. With the knowledge from this article, you’ll be able to debug your React applications, regardless of the environment or browser they are running in.
You can find the code that was used in this article in this GitHub repository .
By Lucien Chemaly
Lucien has a Master's and Engineering Degree in IT and Telecommunications from the University of Rennes, France. He teaches seasonal courses for engineering students at the Saint Joseph University of Beirut and has been involved in programming training for private companies. He also writes for Draft.dev.

Build a Blog that Software Developers Will Read
The Technical Content Manager’s Playbook is a collection of resources you can use to manage a high-quality, technical blog:
- A template for creating content briefs
- An Airtable publishing calendar
- A technical blogging style guide
Safari Dev Tools: The Complete 2023 Guide
Introduction to safari developer tools.
Safari is Apple's proprietary web browser that comes pre-installed on all Mac and iOS devices. Its integrated developer tools provide everything web developers need to build, debug and optimize websites for Apple's ecosystem.
In this comprehensive tutorial, we'll cover key capabilities of Safari's dev tools including:
- The Web Inspector for inspecting page structure and CSS
- The Debugger for stepping through JavaScript code
- The Resources panel for auditing page assets
- The Audits panel for testing web standards compliance
- Device Mode for simulating mobile screens
- Advanced debugging features like conditional breakpoints
- Network throttling to simulate real-world conditions
- Experimental features for early access
By the end, you'll have master expertise using Safari dev tools to squash bugs faster, improve site performance, and deliver exceptional web experiences across Apple devices. You'll also discover resources like DevHunt to continue exploring the latest Safari developer tools.
A Brief History of Safari
Safari originated within Apple in 2003, based on the open source KHTML rendering engine. It was first released for Mac OS X Panther and quickly became Apple's default browser.
In 2007, Apple launched the first Windows version of Safari to expand its userbase. That same year, Safari made its mobile debut on the first iPhone.
Over the years, Safari has gone through many major version updates adding new features and support for emerging web standards. It remains the pre-installed browser on all Apple operating systems and devices including Macs, iPhones and iPads.
Why Learn Safari Developer Tools?
Here are some key reasons web developers should learn Safari dev tools:
- Pre-installed on all Mac and iOS devices, used by millions globally
- Allows direct debugging on iOS devices
- Can emulate mobile devices in desktop browser
- Essential for targeting Apple's ecosystem
- Identify optimizations for Safari to improve site experience
- Learn how your sites perform on Safari and make improvements
- Fix rendering issues specific to WebKit browser engine
- Utilize experimental features to build cutting-edge websites
- Discover new Safari dev tools on platforms like DevHunt
With Safari holding significant browser market share, especially in the mobile space, having expertise in its developer tools is vital for crafting high-quality cross-browser experiences.
Core Safari Developer Tools
Now let's dive into the core developer tools available within Safari on both desktop and mobile.
The Web Inspector
The Web Inspector is the main hub for visually inspecting and modifying a web page. Key functions include:
- View and edit the live DOM tree
- Inspect and modify CSS styles
- Audit accessibility information
- Analyze network requests and performance
- Identify layout issues or style problems
- Live edit code changes right in the browser
For front-end developers, the Inspector is indispensable for debugging HTML, CSS and accessibility issues. You can instantly see how changes to markup and styles affect rendering.
The Debugger
Safari's JavaScript Debugger allows pausing code execution to step through scripts line-by-line. You can:
- Set breakpoints to isolate issues
- Inspect stack traces and variable scopes
- Profile memory usage and CPU utilization
- Emulate device throttling conditions
- Blackbox third-party scripts
The Debugger equips you to tackle even the most complex JavaScript bugs. From tracking down logic errors to profiling performance, it's an essential tool for front-end logic and optimization.
The Resources Panel
This panel displays all resources loaded by the page like scripts, stylesheets, fonts, images and media. For each resource you can:
- View request URLs, status codes and timings
- Filter by type, folder location or domain
- Check dependencies and redundancy
- Audit performance and bottlenecks
- Download resources to your machine
Knowing exactly what resources a page loads is invaluable for optimizing performance. The Resources panel helps you eliminate unnecessary requests and prioritize critical assets.
Storage Inspector
The Storage Inspector lets you view and edit browser storage like cookies, LocalStorage, SessionStorage and IndexedDB. You can:
- Add, modify or delete stored keys and values
- Export storage data as JSON
- Emulate different browser states for testing
- Clear storage entirely to test initial experience
Being able to inspect persistence mechanisms is vital for debugging issues related to state management in modern web apps.
The Audits Panel
Safari's Audits panel runs diagnostics on pages to surface optimization opportunities and standards compliance issues. Audits include:
- Performance analysis and scoring
- Accessibility checks following WCAG guidelines
- Best practices for progressive web apps
- SEO enhancements
- Modern web platform usage
Running audits before launching any website can help you catch critical problems early and compare against industry benchmarks.
Advanced Safari Developer Tools
Beyond the basics, Safari offers powerful advanced tools for seasoned developers.
Device Mode
Device Mode accurately emulates mobile screens and conditions right in desktop Safari:
- Simulate precise device dimensions and resolution
- Throttle CPU and network to mimic real devices
- Essential for building mobile-friendly, responsive sites
- Test touch events and gestures during development
With Device Mode, you can build fully optimized mobile experiences without constantly switching devices.
Advanced Debugging
Safari provides next-level JavaScript debugging capabilities:
- Set conditional breakpoints using expressions
- Group breakpoints for easy management
- Step through async code with async stack traces
- Profile memory heap allocations over time
- Blackbox scripts to hide library code
- Break on caught or uncaught exceptions
These advanced features help you tackle difficult bugs in even the most complex single-page apps and frameworks like Vue.js.
Network Throttling
Network Throttling allows simulating slow network connections, like 3G and LTE. You can:
- Rate limit bandwidth and latency
- Identify assets blocking page load
- Debug loading behavior in emerging markets
- Optimize performance for offline/low-bandwidth
- Throttle cache usage and response compression
Testing how your site performs under real-world network conditions is crucial to providing good user experiences for all.
Experimental Features
Safari lets developers try out experimental tools before they are formally released:
- Get early access to new capabilities
- Provide feedback to help shape future features
- Use at your own risk as they are still in development
- Currently includes CSS Flexbox debugging tools
Tapping into experimental features allows you to build cutting-edge experiences and directly influence the browser platform's evolution.
Debugging JavaScript Issues
Now let's explore strategies for debugging JavaScript using Safari's advanced capabilities.
Breakpoint Usage
Effective breakpoint usage is key for isolating issues:
- Set breakpoints directly within the source code
- Organize breakpoints into groups by context
- Use conditional breakpoints to pause on specific criteria
- Disable breakpoints without deleting to toggle behavior
- Manage breakpoints efficiently even in complex codebases
Mastering breakpoints gives you precise control over pausing execution to inspect logic flow and data.
Scope Inspection
Understanding scope is vital for tracking down variable issues:
- Inspect variable values in different call frames
- Detect scope pollution across closures and modules
- Ensure code executes in the intended lexical scope
- Fix bugs caused by accessing stale variable references
- Avoid global namespace pollution
With Safari's scoping tools, you can confidently debug even complex nested closures and callback contexts.
Async Debugging
Safari provides multiple approaches for debugging asynchronous code:
- Step through promise resolutions and rejections
- Inspect async operation call stacks and task queues
- Profile async code performance with CPU profiler
- Set breakpoints within async callbacks and timers
- Visually trace async code flows
Smooth async debugging helps you tackle race conditions, timing issues, and callback hell.
Error Handling
The key to debugging runtime errors is Safari's break on exception feature:
- Break on any caught or uncaught exceptions
- Inspect error call stacks to trace where issues originate
- Log values with console.log() to debug logic flow
- Validate edge cases and fix crashes
- Handle errors gracefully to improve user experience
With robust error handling, you can isolate bugs quicker and build more resilient apps.
Optimizing Page Speed
Next let's explore some common techniques for optimizing page speed using Safari developer tools.
Image Optimization
Safari provides multiple ways to optimize images:
- Audit image sizes and formats using the Resources panel
- Compress and resize images as needed
- Lazy load offscreen images to improve TTI
- Serve next-gen formats like WebP to Safari users
- Remove unnecessary decorative images
With Safari's insight into image resources, you can significantly cut page weight and load times.
Script Loading
Optimizing script loading is key for performance:
- Minimize parser-blocking JavaScript
- Load non-critical scripts asynchronously
- Dynamically create and load scripts
- Code split bundles into logical chunks
- Tree shake and minify code to reduce payload
Safari shows you exactly how scripts impact loading behavior so you can optimize delivery.
Caching Assets
Effective caching can boost repeat visit performance:
- Set optimal cache lifetimes for static assets
- Cache assets locally using service workers
- Version assets linked to app release cycles
- Avoid cache-busting query strings
- Maximize cache reuse for returning users
The Resources panel helps you dial in caching for faster loads without staleness.
Layout Thrashing
Diagnosing layout thrashing is key for smooth UX:
- Identify forced synchronous layouts
- Defer non-critical DOM updates with requestAnimationFrame()
- Avoid reading styles after writes during rendering
- Batch DOM reads/writes together
- Profile with Debugger to pinpoint problems
With Safari's performance tools, you can isolate and fix sources of jank and lag.
Wrap Up and Key Takeaways
Safari developer tools provide everything needed to build high-quality websites targeting Apple's ecosystem.
Key highlights include:
- Debugging directly on iOS devices with Web Inspector
- Stepping through JavaScript with advanced Debugger features
- Auditing pages for standards compliance
- Simulating mobile devices and networks during development
- Optimizing performance using Network Throttling
- Trying out experimental capabilities early
- Discovering new Safari dev tools on platforms like DevHunt
Learning Safari developer tools allows you to find and fix cross-browser issues faster. You can optimize sites specifically for Safari and deliver stellar experiences to millions of Apple users worldwide.
With a comprehensive understanding of Safari's robust toolset, you can confidently build, debug and enhance modern progressive web apps. Safari developer tools help web developers succeed across platforms.
Related posts
- Safari Developer Tools: The Complete Guide for Web Developers
- Discover the Top Web Developer Tools for 2023
- Unlock Safari's Powerful Developer Tools
- Dev Tools iOS Developers Need in 2023
David Lozzi
- Debugging Safari/Chrome on your iPhone/iPad/iOS device

In the world of modern web development, Web 2.0 (or is it 3.0?), with HTML5, CSS3, ES6, and frameworks and libraries up the wazoo, our web apps and sites always work seamlessly and flawlessly across all the browsers and devices… hahaha, I know…
The reality is, web development, as great and modern as it is, can have little caveats and nuances across the different browsers: Chrome, Safari, FireFox, Edge, and the Mac/Windows/Linux/iOS/Android versions of each. Thankfully, the big contenders like Netscape (those were the days) and Internet Explorer have finally been deprecated and are no longer expected to be supported in the wild. Even with the great modern web, we still have issues once in a while.
In my recent efforts in troubleshooting one small “nuance” between Chrome on Mac and Chrome and Safari on iOS (yes, all three were acting differently), I needed to debug my browser on my iPad and/or iPhone. I won’t get into what the issue is here, instead, I’ll get into how we can debug the browsers on our iOS devices. I’ve searched for many options, some worked, some didn’t, so below is what worked for me.
All steps below are all running on my:
- MacBook Pro 16-inc, M1 Pro, running macOS Ventura 13.6
- iPad Air (4th) v15.3.1
- iPhone 14 Pro Max iOS v17.0.3
What are we debugging
Before we get started in debugging, we should cover what we’re debugging. In the following debugging methods, we can debug anything our browser can get to: netflix.com, google.com, or our public website. With CI/CD in place, I can make code changes and get them into my dev environment in under 5 minutes, and that suffices at times. I can then hit the site directly on my iPhone and debug as needed.
Sometimes, if I’m really diving into a granular issue and don’t want to wait, I like to use ngrok. Ngrok spins up a gateway from a public address to your local dev machine. This allows me to troubleshoot realtime on my mobile browser while writing the code on my laptop. It’s pretty slick and has saved me a lot of time. I can even share the ngrok address with my colleagues and they can access it on my local machine too! Another option would be to set up DNS for your iPhone to navigate to your laptop while on the same wifi network, and that’s not worth the effort in my book.
Debugging in Chrome on iOS
This is great quick way to check out your console messages without using your Mac.
- In Chrome on your iPad or iPhone, go to chrome://inspect and then press Start Logging .
- Now go do your thing in another tab, keeping this tab open.
- Come back anytime to see any and all console outputs!
See, no laptop/desktop needed, just do it on the mobile device.
This is as far as we can get with Chrome on iPhone/iPad. From my limited understanding, Chrome for iOS uses a WKWebView which gets difficult to actually attach to and debug. If the JavaScript console output isn’t enough, try Safari…
Debugging in Safari on iOS
This is a great method of debugging your iOS devices as it gives you the closest thing to actually debugging on your computer. With this method you can use the dev tools on your Mac to connect to your iOS Safari browser. It’s pretty sweet.
- On your Mac , open Safari, then go to Safari > Settings.
- Click Advanced and click Show Develop menu in menu bar at the bottom of the window. Close the window.
- On your iPad or iPhone , go to Settings > Safari > Advanced.
- Scroll to the bottom and enable Web Inspector .
For this next part, I recommend using a USB cable to attach your iOS device to your Mac. You might get away with doing this over Wifi, as I have in the past, but it’s not reliable .
- Connect your device to your Mac using a USB cable, or try the following over Wifi.
- On your Mac, in Safari, click the Develop menu.
- Near the top of the menu you should see your iPad or iPhone listed.
- Hover over your device in the menu and you’ll see Safari with each tab listed below. Click the one you want to debug.
- The Web Inspector should then appear, now debug it: Elements, Console, Sources, Network, all of it should work!
Good enough for now
Between these two techniques, I’ve been able to troubleshoot my issues quite successfully. Generally, iOS Safari and Chrome act relatively the same, so debugging in Safari helps me clear my Chrome issue. And if it doesn’t I can always throw in more console.log s and see what Chrome is actually doing. Ideally, we should be able to debug the code directly on Chrome, like we can do with Safari, but at this time it’s just not possible.
One other option, for a cost: inspect.dev
There’s a product called inspect.dev that boasts it can debug Safari, Webviews, and Chrome from macOS, Windows, and Linux. Learn more at https://inspect.dev/why . I have not tried them out, I don’t want to pay for something that should be free for developers (hence this blog post).
Let me know if you know other ways to debug your mobile browsers! Leave a comment below or let’s connect on Twitter .
‘Til next time, happy debugging!
Please share the love!
- Click to share on Twitter (Opens in new window)
- Click to share on Facebook (Opens in new window)
- Click to share on LinkedIn (Opens in new window)
- Click to email a link to a friend (Opens in new window)
- Click to print (Opens in new window)
- Click to share on Reddit (Opens in new window)
- Click to share on Pocket (Opens in new window)
- Click to share on WhatsApp (Opens in new window)
7 thoughts on “ Debugging Safari/Chrome on your iPhone/iPad/iOS device ”
You should also check out using x-code’s simulator. Safari Dev Tools can attach to the Safari session on the simulator and you’re off to the races!
Oh yea, i just found that and then forgot that… thanks I’ll check it out closer and share my findings!
Thanks for article. One small correction Chrome for iOS uses WKWebView.
Thanks for the fix! will update
- Pingback: [FIXED] The image is taking the original dimentions of it on the phone after deployment - Learn How to FIX your angular code
Thanks bro! I’ll follow yours steps, wish me luck.
Leave a Reply Cancel reply
- Collaboration
- Microsoft Forms
- Microsoft Planner
- Microsoft Power Apps
- Microsoft Power Automate (Flow)
- Microsoft Teams
- Microsoft To-Do
- Office 365 Hybrid
- Office 365 SharePoint Online
- Productivity
- SharePoint 2013 Administration
- SharePoint 2013 Apps
- SharePoint 2013 Development
- SP2010 Administration
- SP2010 Authentication
- SP2010 Customization
- SP2010 Infrastructure
- SP2010 User
- SP2010 Workaround
- Uncategorized
- Users Don't Like SharePoint
Top Posts & Pages
- Sending a beautifully formatted email from Power Automate (Flow)
- Use Microsoft Forms to collect data right into your Excel file
- Saving data from Microsoft Forms into Excel using Power Automate (Flow)
- When Power Automate (Flow) can't find your Microsoft Form
- Understanding Power Automate's Outlook Send Email Actions
- Customize the SharePoint Calendar Colors
- Embedding your JavaScript into a SharePoint page
- SharePoint: Hiding Ribbon and More with IsDlg
- Squeezing a little more formatting out of Microsoft Forms
- Stack Overflow

- 2,081,148 hits
Discover more from David Lozzi
Subscribe now to keep reading and get access to the full archive.
Type your email…
Continue reading

How-To Geek
How to turn on the develop menu in safari on mac.
The Develop menu lets you view page source in Safari on Mac.
Quick Links
How to enable the develop menu in safari on mac, how to view page source in safari on mac.
When you right-click on any web page in Safari on Mac, it doesn't reveal the Show Page Source and Inspect Element buttons. To see these, you need to enable the Develop menu---we'll show you how to do that.
Once you've enabled the Develop menu, right-clicking a blank space on any website will reveal the Inspect Element and Show Page Source buttons. These allow you to take a look at the source code of any website, which is useful for things like downloading images from websites and debugging code or finding out what it looks like behind any site (for website designers).
You can easily turn on the Develop menu in Safari by following a couple of steps. Open Safari on your Mac and click the "Safari" button in the menu bar.
Next, select "Preferences." Alternatively, you can use the keyboard shortcut Command+, (comma). This will also open up Safari preferences.
Go to the "Advanced" tab.
Check the box for "Show Develop Menu in Menu Bar."
Now the Develop menu will appear between Bookmarks and Window at the top.
Apart from being able to view the page source, this will allow you to access developer-focused features, such as disabling JavaScript on any website.
Once you've enabled the Develop menu, there are a couple of ways to view the page source in Safari.
Open any website in Safari and right-click the blank space on the page. Now, select "Show Page Source." You can also get to this menu by using the keyboard shortcut Option+Command+u.
If you're looking for images or other media elements from any web page, Safari makes it easy to find these. In the left-hand pane, you will see various folders such as Images, Fonts, etc. Click the "Images" folder to quickly find the photos that you need.
After selecting an image, you can view its details easily by opening up the details sidebar. The button to open this is located at the top-right of the console, just below the gear icon. You can also open this with the shortcut Option+Command+0.
Click "Resource" at the top of the details sidebar to view details, such as the size of the image and its full URL.
You can change the position of the page source console easily, too. There are two buttons at the top-left of this console, right next to the X button. Click the rectangle icon to move the console to a different side within the browser window.
If you'd like to open the page source console in a separate window, you can click the two-rectangles icon. This will detach the console and open it in a separate window.
To check out the code for any specific element on the page, you can right-click that element and select "Inspect Element." This will take you directly to the code for the element that you selected.
Whenever you're done looking at the code, click the X button to close the page source console and return to browsing on Safari. You can also check out how to view a website's page source in Google Chrome here.
Related: How to View the HTML Source in Google Chrome
How To Open Developer Tools In Safari

- Software & Applications
- Browsers & Extensions

Introduction
When it comes to web browsing, Safari stands out as a popular choice for Mac and iOS users. Whether you're a web developer, a tech enthusiast, or simply someone curious about the inner workings of the websites you visit, Safari's Developer Tools can provide valuable insights and functionalities. These tools empower users to inspect, debug, and optimize web content, making them indispensable for anyone involved in web development or simply interested in understanding the technical aspects of the internet.
In this article, we'll delve into the process of opening Developer Tools in Safari on both Mac and iOS devices. By the end, you'll have a comprehensive understanding of how to access these powerful tools, enabling you to explore the underlying structure of web pages, analyze network activity, and experiment with various web development features.
Let's embark on this journey to uncover the hidden capabilities of Safari's Developer Tools, empowering you to gain a deeper understanding of the web and its intricate design. Whether you're a seasoned developer or a curious individual eager to peek behind the digital curtain, the following sections will equip you with the knowledge to harness the full potential of Safari's Developer Tools.
Opening Developer Tools in Safari on Mac
Opening Developer Tools in Safari on a Mac is a straightforward process that provides access to a wealth of powerful features for web development and debugging. Whether you're a seasoned developer or a curious individual eager to explore the inner workings of websites, Safari's Developer Tools offer a comprehensive suite of functionalities to aid in understanding and optimizing web content.
To initiate the process of opening Developer Tools in Safari on a Mac, you can follow these simple steps:
Using the Menu Bar:
- Launch Safari on your Mac and navigate to the menu bar located at the top of the screen.
- Click on "Safari" in the menu bar to reveal a dropdown menu.
- From the dropdown menu, select "Preferences" to access Safari's settings.
Accessing the Advanced Settings:
- Within the Preferences window, click on the "Advanced" tab located at the far right.
- Check the box next to "Show Develop menu in menu bar" to enable the Develop menu within Safari.
Opening Developer Tools:
- Once the Develop menu is enabled, navigate back to the menu bar at the top of the screen.
- Click on "Develop" to reveal a dropdown menu containing various web development tools and options.
- From the dropdown menu, select "Show Web Inspector" to open the Developer Tools panel.
Upon completing these steps, the Developer Tools panel will appear, providing access to a wide array of functionalities such as inspecting elements, analyzing network activity, debugging JavaScript, and much more. This powerful suite of tools empowers users to delve into the underlying structure of web pages, identify and rectify issues, and optimize the performance of web content.
By familiarizing yourself with the process of opening Developer Tools in Safari on a Mac, you gain the ability to harness the full potential of these tools, enabling you to explore, analyze, and enhance the web browsing experience. Whether you're a web developer seeking to fine-tune a website's performance or simply intrigued by the technical aspects of the internet, Safari's Developer Tools on Mac provide a gateway to a deeper understanding of web development and design.
Opening Developer Tools in Safari on iPhone or iPad
Accessing Developer Tools in Safari on an iPhone or iPad allows users to gain valuable insights into the technical aspects of web content and perform various web development tasks directly from their mobile devices. Whether you're a web developer on the go or simply curious about the inner workings of websites, Safari's Developer Tools provide a convenient way to inspect, debug, and optimize web content on iOS devices.
To initiate the process of opening Developer Tools in Safari on an iPhone or iPad, follow these simple steps:
Launching Safari: Begin by unlocking your iPhone or iPad and locating the Safari icon on the home screen. Tap the Safari icon to open the Safari browser .
Enabling Developer Tools: With Safari open, navigate to the website or web page you wish to inspect and debug. Once on the desired web page, tap the address bar at the top of the screen to reveal the URL and other options.
Accessing Developer Tools: In the address bar, enter "inspect://" followed by the URL of the web page you are currently viewing. For example, if you are on the website "example.com," you would enter "inspect://example.com" in the address bar and tap "Go" or the "Enter" key on the on-screen keyboard .
Upon completing these steps, Safari's Developer Tools will be activated, providing access to a range of functionalities such as inspecting elements, analyzing network activity, debugging JavaScript, and more. This powerful suite of tools empowers users to delve into the underlying structure of web pages, identify and rectify issues, and optimize the performance of web content directly from their iPhone or iPad.
By familiarizing yourself with the process of opening Developer Tools in Safari on an iPhone or iPad, you gain the ability to harness the full potential of these tools, enabling you to explore, analyze, and enhance the web browsing experience while on the go. Whether you're a web developer seeking to troubleshoot a website's functionality or simply intrigued by the technical aspects of the internet, Safari's Developer Tools on iOS devices provide a convenient gateway to a deeper understanding of web development and design.
Leave a Reply Cancel reply
Your email address will not be published. Required fields are marked *
Save my name, email, and website in this browser for the next time I comment.
- Crowdfunding
- Cryptocurrency
- Digital Banking
- Digital Payments
- Investments
- Console Gaming
- Mobile Gaming
- VR/AR Gaming
- Gadget Usage
- Gaming Tips
- Online Safety
- Software Tutorials
- Tech Setup & Troubleshooting
- Buyer’s Guides
- Comparative Analysis
- Gadget Reviews
- Service Reviews
- Software Reviews
- Mobile Devices
- PCs & Laptops
- Smart Home Gadgets
- Content Creation Tools
- Digital Photography
- Video & Music Streaming
- Online Security
- Online Services
- Web Hosting
- WiFi & Ethernet
- Browsers & Extensions
- Communication Platforms
- Operating Systems
- Productivity Tools
- AI & Machine Learning
- Cybersecurity
- Emerging Tech
- IoT & Smart Devices
- Virtual & Augmented Reality
- Latest News
- AI Developments
- Fintech Updates
- Gaming News
- New Product Launches
- Fintechs and Traditional Banks Navigating the Future of Financial Services
- AI Writing How Its Changing the Way We Create Content
Related Post
How to find the best midjourney alternative in 2024: a guide to ai anime generators, unleashing young geniuses: how lingokids makes learning a blast, 10 best ai math solvers for instant homework solutions, 10 best ai homework helper tools to get instant homework help, 10 best ai humanizers to humanize ai text with ease, sla network: benefits, advantages, satisfaction of both parties to the contract, related posts.

How To Enable Inspect In Safari
How To Open Developer Tools On Safari
How To Post On Instagram From Mac Safari
How To Inspect Page On Safari

How To Inspect On IPhone Safari

How To Reset Safari 9.0

How To Inspect On Safari IPhone
How To Change Location In Safari
Recent stories.

Fintechs and Traditional Banks: Navigating the Future of Financial Services

AI Writing: How It’s Changing the Way We Create Content

How to Know When it’s the Right Time to Buy Bitcoin

How to Sell Counter-Strike 2 Skins Instantly? A Comprehensive Guide

10 Proven Ways For Online Gamers To Avoid Cyber Attacks And Scams

- Privacy Overview
- Strictly Necessary Cookies
This website uses cookies so that we can provide you with the best user experience possible. Cookie information is stored in your browser and performs functions such as recognising you when you return to our website and helping our team to understand which sections of the website you find most interesting and useful.
Strictly Necessary Cookie should be enabled at all times so that we can save your preferences for cookie settings.
If you disable this cookie, we will not be able to save your preferences. This means that every time you visit this website you will need to enable or disable cookies again.
Debug, Inspect , Done.
Inspect helps you debug the mobile web on ios and android by giving you an all-in-one developer tool for macos, windows, and linux..

Join the best
You are in good hands.
Engineers from these companies are already happy (Inspect)ors, more productive and saving time.
Why Inspect?
Debug the web on ios devices.
Inspect enables to you debug Safari and WebViews on your iOS device.
Debug the web on Android
Inspect enables you to debug Chrome and WebViews on your Android device.
No new hardware needed
No new hardware needed. Inspect is provides a software-only solution that works across platforms.
UI from Chrome DevTools
Inspect is built on Chrome DevTools, so you feel right at home from day one.
Inspect over Wifi (on MacOS)
Inspect supports debugging of iOS devices over WIFI on macOS. It's time to let go of the cables.
Screencasting (experimental)
Inspect gives you screencasting for iOS and Android so you can see your changes as you go. All without leaving Inspect.
Works on macOS, Linux and Windows
Inspect and debug your web apps and websites on iOS and Android from macOS, Windows and Linux.
React Developer Tools
Use React Developer Tools to inspect React components , edit props and state , and identify performance problems.
You will learn
- How to install React Developer Tools
Browser extension
The easiest way to debug websites built with React is to install the React Developer Tools browser extension. It is available for several popular browsers:
- Install for Chrome
- Install for Firefox
- Install for Edge
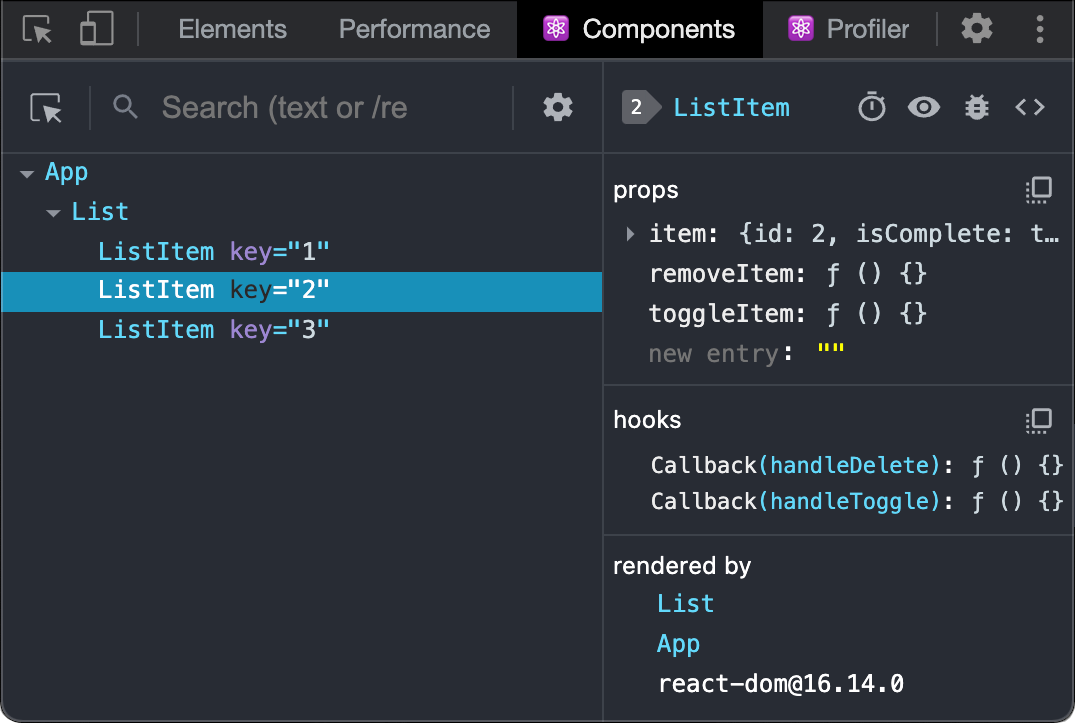
Now, if you visit a website built with React, you will see the Components and Profiler panels.
Safari and other browsers
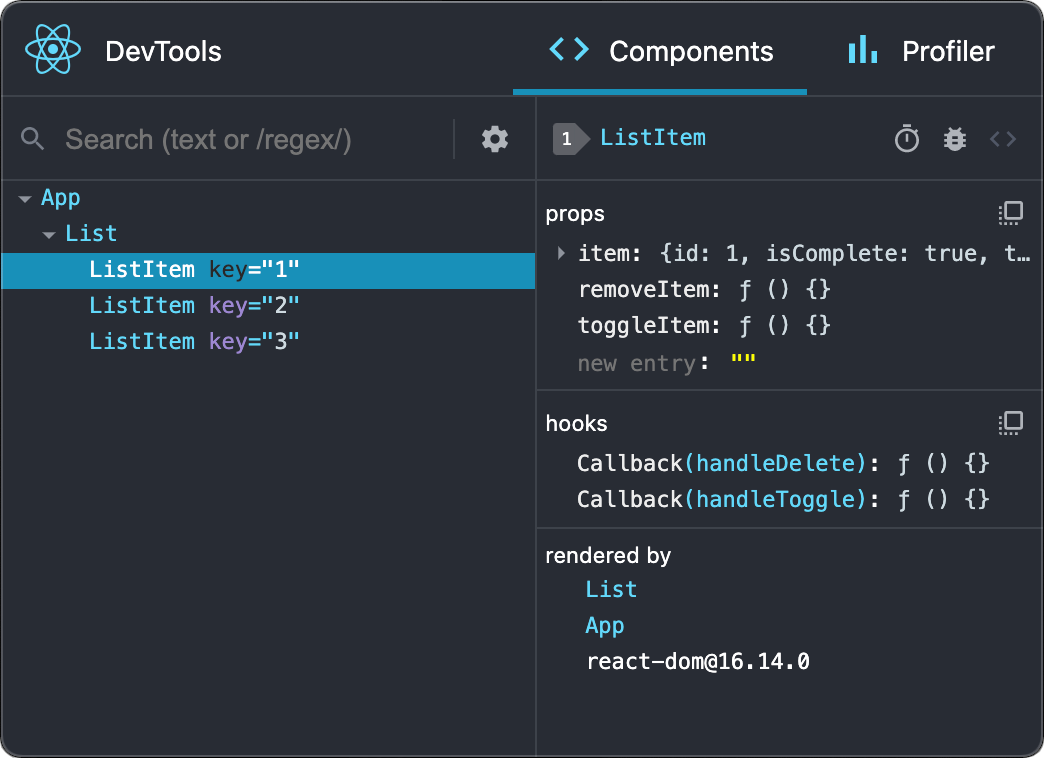
For other browsers (for example, Safari), install the react-devtools npm package:
Next open the developer tools from the terminal:
Then connect your website by adding the following <script> tag to the beginning of your website’s <head> :
Reload your website in the browser now to view it in developer tools.
Mobile (React Native)
React Developer Tools can be used to inspect apps built with React Native as well.
The easiest way to use React Developer Tools is to install it globally:
Next open the developer tools from the terminal.
It should connect to any local React Native app that’s running.
Try reloading the app if developer tools doesn’t connect after a few seconds.
Learn more about debugging React Native.
How do you like these docs?
Vue Devtools
Browser devtools extension for debugging Vue.js applications
💚️ Become a Sponsor
- Español – América Latina
- Português – Brasil
- Tiếng Việt
- More panels
Autofill: Inspect and debug saved addresses

Use the Autofill panel to inspect and debug address info saved to Chrome.
Chrome Autofill provides a convenient way to automatically fill forms on websites with saved addresses. The Autofill panel in DevTools lets you inspect the mapping between your form fields, predicted autofill values, and saved data.
Save address info to Chrome
By default, Chrome prompts you to save address info you entered into a web form when you submit it.

If there's no such prompt, in Chrome's top right corner, navigate to more_vert Customize and control Google Chrome > key Password and Autofill > location_on Addresses and more and turn on toggle_on Save and fill addresses . You can also add new addresses here.

Open the Autofill panel
By default, the Autofill panel automatically opens if DevTools is open and when you autofill a form on a website. To turn this off, open the panel manually and clear the check_box_outline_blank Automatically open this panel checkbox.
To manually open the Autofill panel:
- Open DevTools .
Open the Command menu by pressing:
- macOS: Command + Shift + P
- Windows, Linux, ChromeOS: Control + Shift + P

Start typing autofill , select Show Autofill , and press Enter .
DevTools opens the panel in the Drawer at the bottom of your DevTools window by default. You can also move it to the top .
Alternatively, you can open the Autofill panel in the following ways:
- In the action bar at the top, click double_arrow More panels and select Autofill from the drop-down list.
- In the top right corner, select more_vert Customize and control DevTools > More tools > Autofill .
Inspect autofill data
To inspect autofill data:
- Make sure Autofill is turned on and you have address info saved in Chrome.
- Open DevTools , for example, on this demo page .
- In the address web form on the demo page, focus a form field. Chrome shows a drop-down menu with autofill data options.
- Select an option from the menu. Autofill fills the form with saved data and DevTools opens the Autofill panel if auto-open is turned on . Otherwise, open the Autofill panel manually.

Data and its mapping
The Autofill panel shows the data it inserted in the form fields and a table with mapping between the following:
- Form field detected on the page.
- Predicted autofill value , which Autofill determines using heuristics.
- Value , if any, that Autofill inserted into fields it recognized.

Except as otherwise noted, the content of this page is licensed under the Creative Commons Attribution 4.0 License , and code samples are licensed under the Apache 2.0 License . For details, see the Google Developers Site Policies . Java is a registered trademark of Oracle and/or its affiliates.
Last updated 2024-04-16 UTC.

Teams Toolkit for Visual Studio Code update – April 2024
April 23rd, 2024 0 0
In this April 2024 update of Teams Toolkit for Visual Studio Code, we’ve added improvements to build API message extensions with an auth-protected API, new getting started experiences for building intelligent chat bots, and features to build add-ins for Word, Excel, and PowerPoint, and more.
Create API based message extensions using auth-protected API
Teams Toolkit supports two types of API authentication protection in your API based Message extension apps:
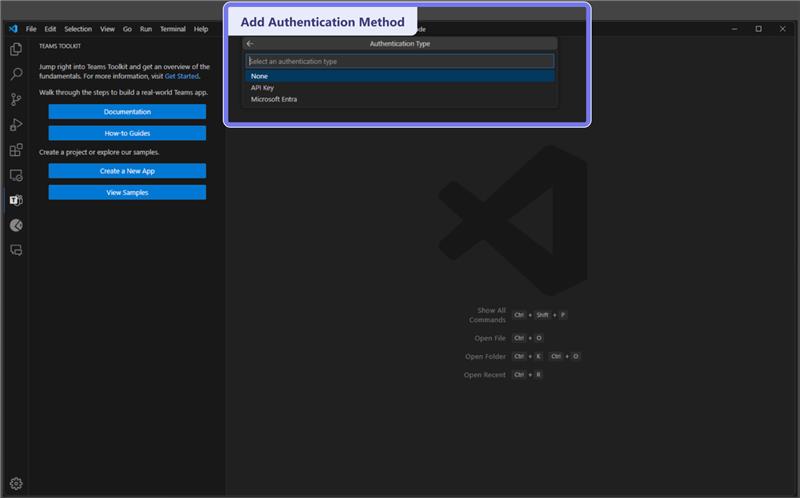
- API-Key: you can either add the API key of your existing API, or if you don’t have an API, Teams Toolkit can generate create a new API project for you.
- Microsoft Entra (Azure AD): Teams Toolkit can help you create a Microsoft Entra ID to authenticate your new API.
Debug message extensions in Teams App Test Tool
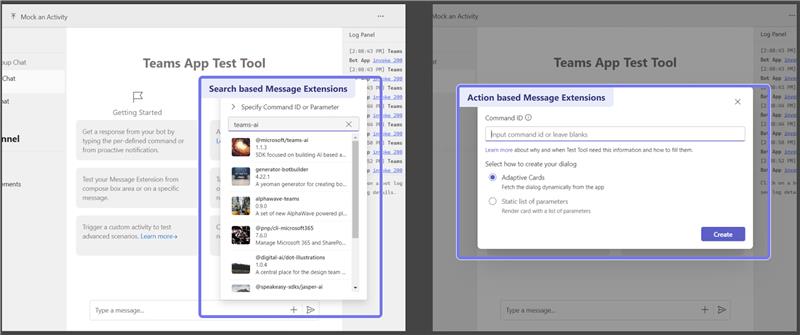
Teams App Test Tool helps developers to debug and test apps in a web-based environment Microsoft Teams-like features without requiring network tunnels or a Microsoft 365 account. In this version we’ve added support for search-based, action-based, and link unfurling Message extensions.
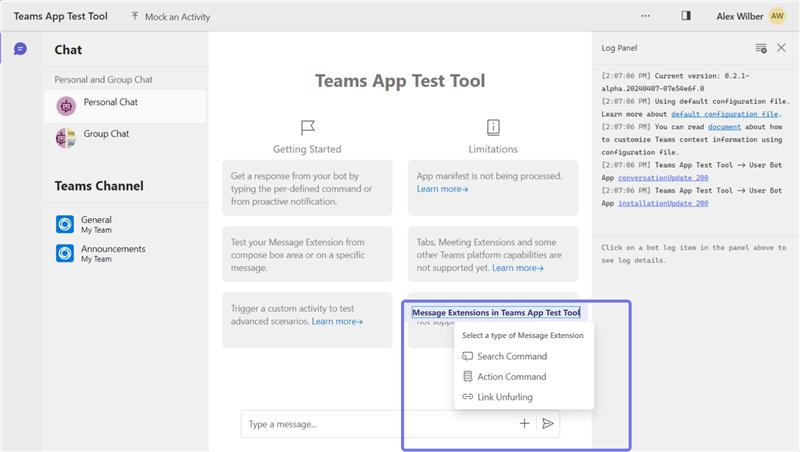
Running your Teams apps with these capabilities with the Test Tool shows a familiar interface that makes iterating on your app simple and fast.
Create an intelligent chatbot with domain knowledge from custom data
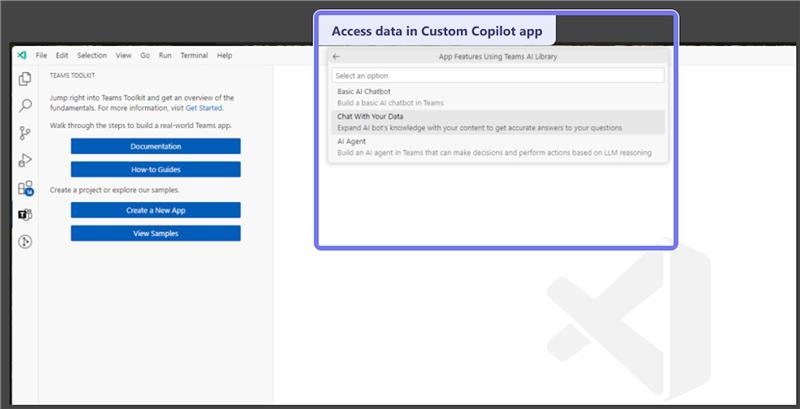
The new Custom copilot template helps you get started with building an AI-powered chatbot that can understand natural language and retrieve custom data to answer domain-specific questions using Retrieval Augmentation Generation (RAG).
When creating the Custom copilot app, you can select “Chat with your data” and then select the desired data source.
There are four kinds of data source for you to choose:
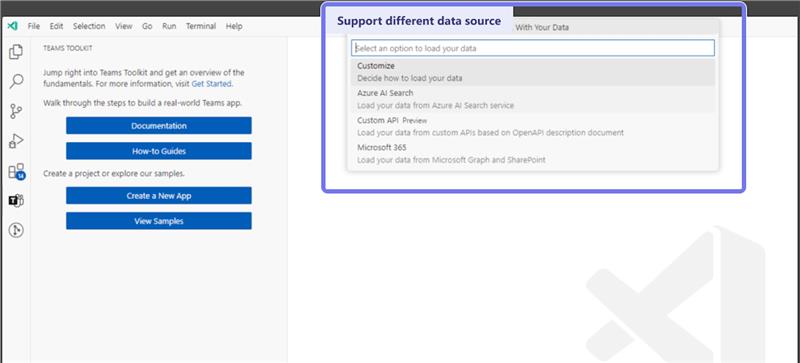
- Custom data source: you can add whatever data sources you want to a Custom copilot app, for example: file system or vector database.
- Azure AI Search: your chatbot can access data on an Azure AI Search service and use it in conversation with users.
- Custom API: your chatbot can invoke the API defined in the OpenAPI description document to retrieve domain data from an API service.
- Microsoft Graph + SharePoint: your chatbot can query M365 data from the Microsoft Graph Search API as a data source in the conversation.
Develop Word, Excel and PowerPoint Add-ins in Teams Toolkit
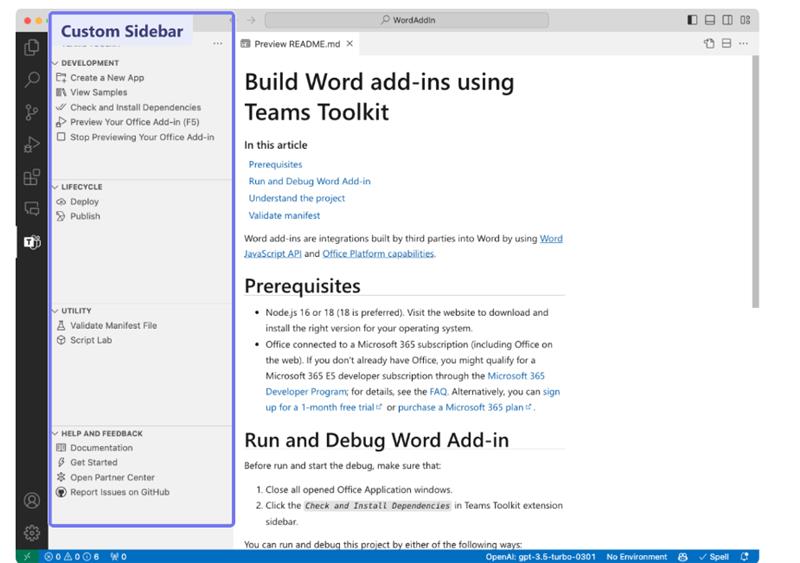
Teams Toolkit now supports Microsoft Word, Excel, or PowerPoint JavaScript add-in development and includes features for checking dependencies, running and debugging add-ins, managing lifecycle, providing feedback, and more.
Enhancements
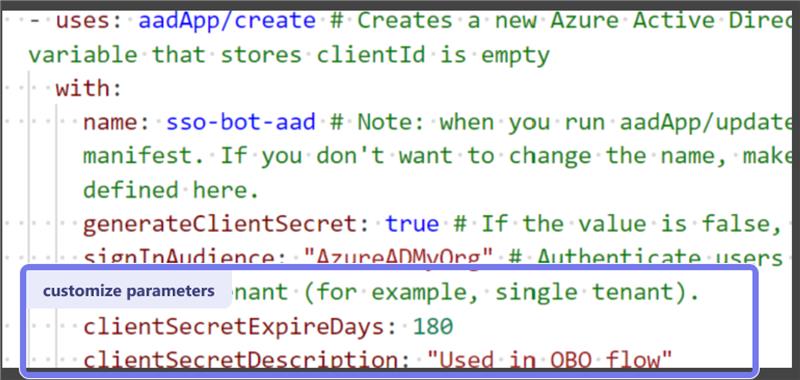
We’ve smoothed the experience of creating Entra ID client secrets with features that let you customize the `clientSecretExpireDays` and `clientSecretDescription` parameters in teamsapp.yml.
Share your feedback
We’d really appreciate your early feedback! Download the latest prerelease of Teams Toolkit and explore these new features and improvements today!
Remember, your feedback is valuable in shaping the future of Teams Toolkit. Share your thoughts and suggestions with us on GitHub , and let’s build together!
Follow us on X (Twitter) / @Microsoft365Dev , LinkedIn , and subscribe to our YouTube channel to stay up to date on the latest developer news and announcements.

Leave a comment Cancel reply
Log in to start the discussion.

Insert/edit link
Enter the destination URL
Or link to existing content
View in English
Web development tools
Apple has brought its expertise in development tools to the web. Safari includes Web Inspector, a powerful tool that makes it easy to modify, debug, and optimize websites for peak performance and compatibility on both platforms. And with Responsive Design Mode, you can preview your web pages in various screen sizes, orientations, and resolutions. Access these tools by enabling the Develop menu in Safari’s Advanced preferences.
Web Inspector
Web Inspector is your command center, giving you quick and easy access to the richest set of development tools ever included in a web browser. It helps you inspect all of the resources and activity on a web page, making development more efficient across Apple platforms. The clean, unified design puts each core function in a separate tab, which you can rearrange to fit your workflow. You can even debug memory using Timelines and tweak styles using widgets for over 150 of the most common CSS properties.

Elements. View and inspect the elements that make up the DOM of a web page. Clicking elements from the fully editable markup tree on the left reveals the node’s styles in the middle sidebar, with more details in the right sidebar.

Console. Type JavaScript commands in the console to interactively debug, modify, and get information about your webpage. View logs, errors, and warnings emitted from a webpage, so you can identify issues fast and resolve them right away.

Sources. Find every resource of a webpage, including documents, images, scripts, stylesheets, and more. Use the built-in debugger with data type and code highlights to troubleshoot and understand the script execution flow.

Network. See a detailed list of all network requests made to load every web page resource, so you can quickly evaluate the response, status, timing, and more.

Timelines. Understand all the activity that occurs on an open web page, such as network requests, layout and rendering, JavaScript events, memory, and CPU impact. Everything is neatly plotted on a timeline or recored by frame, helping you discover ways to optimize your site.

Storage. Find details about the data stored by a web page, such as application cache, cookies, databases, indexed databases, local storage, and session storage.

Graphics. Preview animation keyframes and their classes from HTML5 canvas, JavaScript animations, CSS animations, and CSS transitions. Dial in the motion and the visual design of web pages.

Layers. Visualize compositing layers in 3D to understand where layers are generated and in what order they'll render. Use layers to help find unexpected memory consumption or excessive repaints on a web page.

Audit. Preform audits against a web page to certify that common code and accessibility errors are addressed. Confirm that a web page follows design guidelines and specifications of modern web pages.
Responsive Design Mode
Safari has a powerful new interface for designing responsive web experiences. Responsive Design Mode provides a simple interface for quickly previewing your web page across various screen sizes, orientations, and resolutions, as well as custom viewports and user agents. You can drag the edges of any window to resize it. And you can click on a device to toggle its orientation, taking it from portrait to landscape — and even into Split View on iPad.

IMAGES
VIDEO
COMMENTS
Web development tools. Apple has brought its expertise in development tools to the web. Safari includes Web Inspector, a powerful tool that makes it easy to modify, debug, and optimize websites for peak performance and compatibility on both platforms. And with Responsive Design Mode, you can preview your web pages in various screen sizes ...
Connect the iOS device to the machine. Enable the Web-Inspector option. To do so: Go to Settings > Safari > Scroll down to the bottom > Open Advanced Menu>. Turn on Web Inspector. Open the desired web page to debug or preview on your mobile Safari browser. Once done, enable the Develop menu on the Mac device.
Activate Web Inspector on iOS: Go to Settings > Safari > Advanced and move the Web Inspector toggle switch to the On position. Use Web Inspector on macOS: Connect your iOS device to a Mac and choose the URL to inspect from the Develop menu. If you run into a bug or another issue with a website on Safari mobile, use the Web Inspector tool to ...
Access tools for debugging webpages in Safari, as well as tools for debugging web content in other apps and on other devices. Responsive Design Mode. Use Responsive Design Mode to test your media queries and other dynamic styles to ensure your webpages look great on any screen.
To open the Safari Developer Tools, right-click on Inspect and start debugging. You can leverage other built-in features offered by LambdaTest, like geolocation testing, uploading files, accessibility, and much more. Using Safari, you can use the Responsive Design Mode while debugging your websites on LambdaTest.
To debug your website using the Responsive Design mode on Safari, follow the steps mentioned below: Enable the Developer Menu. To do that, launch the Safari Browser on your Mac computer. Go to Preferences > Advanced and check the Show Develop menu in the menu bar. Navigate to the website you want to debug.
Enable Web Inspector on iOS : Open the Settings app on your iPhone or iPad. Scroll down and tap Safari. Scroll to the bottom of the page and tap Advanced. Tap the toggle next to Web Inspector to the On position. Enable Safari Developer Mode on Mac : Open Safari on your Mac. Click Safari in the top left corner of your Menu Bar.
To enable Safari Developer Tools, open Safari, click Safari in your menu bar, and then select Preferences. You can also use Command-Comma keyboard shortcut to open Safari's Preferences dialog. Locate and select the Advanced menu. At the bottom of this menu you should see a checkbox that is labeled "Show Develop menu in menu bar".
To access the Responsive Design Mode, enable the Safari Develop menu. Follow the steps below to enable the Develop menu: Launch Safari browser. Click on Safari -> Settings -> Advanced. Select the checkbox -> Show Develop menu in menu bar. Once the Develop menu is enabled, it'll show up in the menu bar as shown in the image below: Note ...
How to Debug a React App in Safari. The following tutorial explains how to use the standalone version of React DevTools to debug a React application running in Safari. By the end, you'll be equipped with the knowledge and tools you need to confidently debug your React application. Prerequisites. To complete this tutorial, you'll need:
This method provides a convenient and intuitive way to leverage the power of Safari's developer tools, empowering you to create, debug, and optimize websites with precision and efficiency. Method 2: Using Keyboard Shortcuts. Harnessing the power of keyboard shortcuts is a time-saving and efficient way to access developer tools in Safari.
Its integrated developer tools provide everything web developers need to build, debug and optimize websites for Apple's ecosystem. In this comprehensive tutorial, we'll cover key capabilities of Safari's dev tools including: The Web Inspector for inspecting page structure and CSS. The Debugger for stepping through JavaScript code.
To enable Developer Tools in Safari, follow these simple steps: Open Safari Preferences: Launch Safari and navigate to the "Safari" menu located in the top-left corner of the screen. From the drop-down menu, select "Preferences." Access Advanced Settings: In the Preferences window, click on the "Advanced" tab.
Connect your device to your Mac using a USB cable, or try the following over Wifi. On your Mac, in Safari, click the Develop menu. Near the top of the menu you should see your iPad or iPhone listed. Hover over your device in the menu and you'll see Safari with each tab listed below. Click the one you want to debug.
Open Safari on your Mac and click the "Safari" button in the menu bar. Next, select "Preferences." Alternatively, you can use the keyboard shortcut Command+, (comma). This will also open up Safari preferences. Go to the "Advanced" tab. Check the box for "Show Develop Menu in Menu Bar." Now the Develop menu will appear between Bookmarks and ...
To initiate the process of opening Developer Tools in Safari on a Mac, you can follow these simple steps: Using the Menu Bar: Launch Safari on your Mac and navigate to the menu bar located at the top of the screen. Click on "Safari" in the menu bar to reveal a dropdown menu. From the dropdown menu, select "Preferences" to access Safari's settings.
Inspect and debug Safari. Chrome and WebViews on Android. Inspect and debug Android. Ionic & Capacitor Apps. Inspect and debug Ionic & Capacitor apps ... Done. Inspect helps you debug the mobile web on iOS and Android by giving you an all-in-one developer tool for macOS, Windows, and Linux. Download Inspect. Join the best. You are in good hands ...
The easiest way to debug websites built with React is to install the React Developer Tools browser extension. It is available for several popular browsers: ... with React, you will see the Components and Profiler panels. Safari and other browsers . For other browsers (for example, Safari), install the react-devtools npm package: # Yarn. yarn ...
Browser devtools extension for debugging Vue.js applications
Overview. The Develop menu is home to the tools available to design and develop web content in Safari, as well as web content used by other applications on your Mac and other devices. The Develop menu also provides quick access to Changing Developer settings in Safari on macOS and Changing Feature Flag settings in Safari on macOS.. Note. If you haven't already enabled features for web ...
Use the Autofill panel to inspect and debug address info saved to Chrome.. Overview. Chrome Autofill provides a convenient way to automatically fill forms on websites with saved addresses. The Autofill panel in DevTools lets you inspect the mapping between your form fields, predicted autofill values, and saved data.. Note: The Autofill panel lets you inspect only the address info.
In this April 2024 update of Teams Toolkit for Visual Studio Code, we've added improvements to build API message extensions with an auth-protected API, new getting started experiences for building intelligent chat bots, and features to build add-ins for Word, Excel, and PowerPoint, and more.
Safari includes Web Inspector, a powerful tool that makes it easy to modify, debug, and optimize websites for peak performance and compatibility on both platforms. And with Responsive Design Mode, you can preview your web pages in various screen sizes, orientations, and resolutions.